GBP/USD closed above the 100-day Simple Moving Average (SMA), currently located near 1.3430, after briefly dipping below that level on Wednesday. Additionally, the Relative Strength Index (RSI) indicator on the 4-hour chart holds above 50, reflecting sellers' hesitancy.
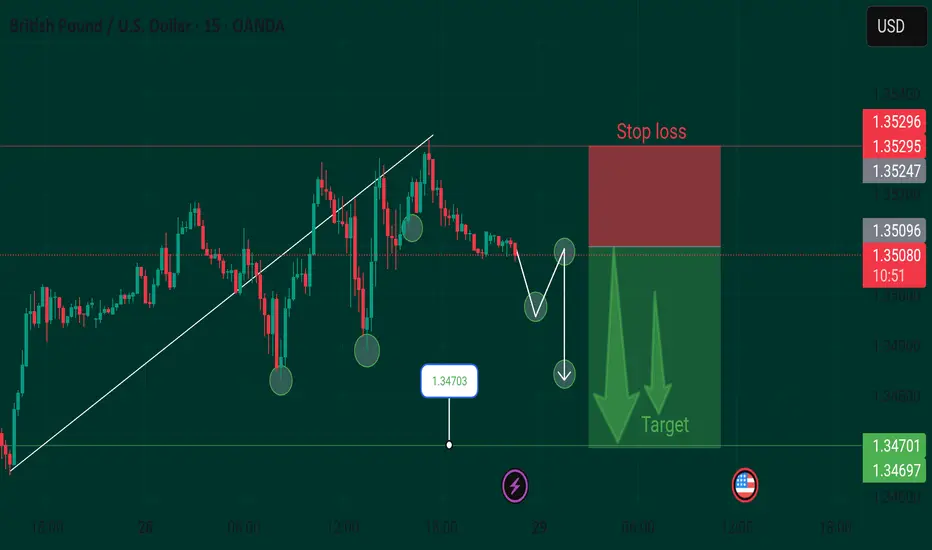
On the upside, 1.3540 (Fibonacci 61.8% retracement of the latest downtrend) could be seen at the next resistance level before 1.3600 (static level, round level) and 1.3640 (Fibonacci 78.6% retracement). Looking south, 1.3460 (Fibonacci 50% retracement) could be seen as an interim support level ahead of 1.3430 (100-day SMA, 200-period SMA on the 4-hour chart) and 1.3400-1.3390 (static level, Fibonacci 38.2% retracement of the latest downtrend).
On the upside, 1.3540 (Fibonacci 61.8% retracement of the latest downtrend) could be seen at the next resistance level before 1.3600 (static level, round level) and 1.3640 (Fibonacci 78.6% retracement). Looking south, 1.3460 (Fibonacci 50% retracement) could be seen as an interim support level ahead of 1.3430 (100-day SMA, 200-period SMA on the 4-hour chart) and 1.3400-1.3390 (static level, Fibonacci 38.2% retracement of the latest downtrend).
Disclaimer
The information and publications are not meant to be, and do not constitute, financial, investment, trading, or other types of advice or recommendations supplied or endorsed by TradingView. Read more in the Terms of Use.
Disclaimer
The information and publications are not meant to be, and do not constitute, financial, investment, trading, or other types of advice or recommendations supplied or endorsed by TradingView. Read more in the Terms of Use.