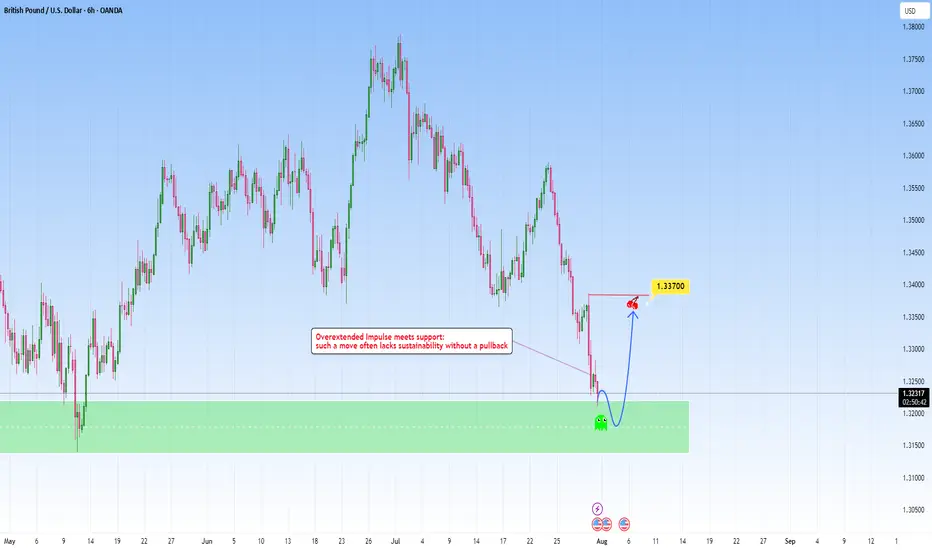
GBPUSD: Overextended move meets with supportAfter a steep and aggressive sell-off, price has tapped into a clear zone. This recent move wasn't gradual: it was impulsive and sharp, which tells us one key thing: exhaustion is likely.
The overextension into it without any meaningful pullback typically highlights imbalance, where price moves ahe
About British Pound / U.S. Dollar
GBPUSD, often referred to as “The Cable”, a foreign exchange term used to describe the British pound vs the US dollar, is one of the oldest traded currency pairs. In July of 1866, after an earlier failed attempt, the first reliable exchange rate between the British pound and the US dollar was transmitted between the London and New York Exchanges. Optic fibre cables accompanied by satellites handle the Transatlantic communications today.
Related currencies
GBPUSD Technical Overview GBPUSD Technical Overview
GBPUSD recently peaked at 1.3790, aligning with a key historical resistance zone from October 2021. On the Daily Chart, this move completed a significant bearish pattern, suggesting the potential for further downside.
Over the last 7 trading sessions, the pair has decli

GBPUSD – Bearish Bounce Loading?Hello TradingView Family / Fellow Traders. This is Richard, also known as theSignalyst.
📈GBPUSD has been overall bearish trading within the falling channel marked in red and it is currently in a correction phase.
Moreover, the blue zone is a strong supply.
📚 As per my trading style:
As #GBPUS

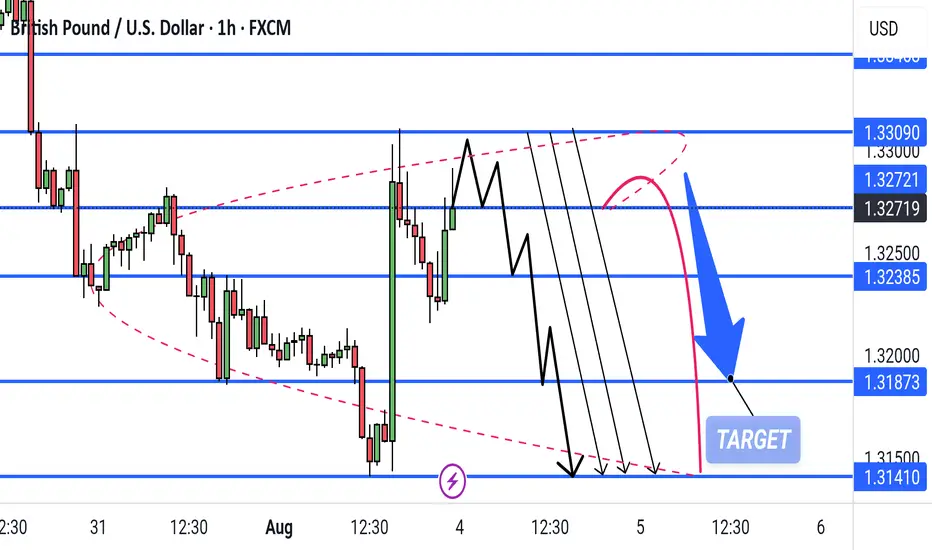
GBP/USD Bearish Wedge Breakdown Setup Targeting 1.31873This is a 1-hour GBP/USD chart showing a bearish setup. Price is currently at resistance (1.32719) within a rising wedge pattern. Multiple black arrows suggest potential bearish breakdown scenarios targeting 1.31873, with a deeper drop possible toward 1.31410. The red path indicates a less likely bu
GBP/USD 4H Chart – Head and Shoulders Breakdown with Bearish Currency Pair: GBP/USD (British Pound vs US Dollar)
Timeframe: 4-Hour (4H)
Platform: TradingView
---
🔍 Pattern Identified:
Head and Shoulders Pattern
Left Shoulder, Head, and Right Shoulder are marked.
The neckline is broken, confirming a bearish trend reversal.
The trendline from March to

Support & Resistance – Quick Guide In 5 StepsSupport and resistance are key concepts in technical analysis that help traders identify where price is likely to react.
Support acts like a floor — a level where buying interest is strong enough to prevent further declines.
Resistance acts like a ceiling — a level where selling pressure can

GBP/USD: Sell setup shaping upHey everyone, what’s your take on GBP/USD right now?
After breaking below the trendline, GBP/USD tried to retest the area but failed to hold. Price is now hovering around 1.329, and the selling pressure is still clearly present.
This current setup is aiming toward the Fibonacci 1.618 extension zon

GBPUSD shows signs of a potential recoveryGBPUSD shows signs of a potential recovery towards the resistance zone. This price action indicates a possible short-term reversal or consolidation phase. We are currently observing for confirmation signals such as:
These could signal a build-up for a move back toward the key resistance at 1.34400.

GBP/USD pair on a 4H timeframMy analyzing the GBP/USD pair on a 4H timeframe using the Ichimoku Cloud and Volume Profile (Visible Range), along with marked support and resistance zones. From this image, I can guide you with a target price level, but you'll need to validate with price action confirmation.
Observations:
1. Ichi

GBPUSD - SERA - Market StructureGBPUSD - SERA - Market Structure - use risk and trade managment for best result
See all ideas
Summarizing what the indicators are suggesting.
Oscillators
Neutral
SellBuy
Strong sellStrong buy
Strong sellSellNeutralBuyStrong buy
Oscillators
Neutral
SellBuy
Strong sellStrong buy
Strong sellSellNeutralBuyStrong buy
Summary
Neutral
SellBuy
Strong sellStrong buy
Strong sellSellNeutralBuyStrong buy
Summary
Neutral
SellBuy
Strong sellStrong buy
Strong sellSellNeutralBuyStrong buy
Summary
Neutral
SellBuy
Strong sellStrong buy
Strong sellSellNeutralBuyStrong buy
Moving Averages
Neutral
SellBuy
Strong sellStrong buy
Strong sellSellNeutralBuyStrong buy
Moving Averages
Neutral
SellBuy
Strong sellStrong buy
Strong sellSellNeutralBuyStrong buy
Displays a symbol's price movements over previous years to identify recurring trends.
Frequently Asked Questions
The current rate of GBPUSD is 1.33754 USD — it has decreased by −0.01% in the past 24 hours. See more of GBPUSD rate dynamics on the detailed chart.
The value of the GBPUSD pair is quoted as 1 GBP per x USD. For example, if the pair is trading at 1.50, it means it takes 1.5 USD to buy 1 GBP.
The term volatility describes the risk related to the changes in an asset's value. GBPUSD has the volatility rating of 0.25%. Track all currencies' changes with our live Forex Heatmap and prepare for markets volatility.
The GBPUSD showed a 0.86% rise over the past week, the month change is a −1.84% fall, and over the last year it has increased by 5.39%. Track live rate changes on the GBPUSD chart.
Learn how you can make money on rate changes in numerous trading ideas created by our community.
Learn how you can make money on rate changes in numerous trading ideas created by our community.
GBPUSD is a major currency pair, i.e. a popular currency paired with USD.
Currencies are usually traded through forex brokers — choose the one that suits your needs and go ahead. You can trade GBPUSD right from TradingView charts — just log in to you broker account. Check out the list of our integrated brokers and find the best one for your needs and strategy.
When deciding to buy or sell currency one should keep in mind many factors including current geopolitical situation, interest rates, and other. But before plunging into a deep research, you can start with GBPUSD technical analysis. The technical rating for the pair is neutral today, but don't forget that markets can be very unstable, so don't stop here. According to our 1 week rating the GBPUSD shows the buy signal, and 1 month rating is buy. See more of GBPUSD technicals for a more comprehensive analysis.