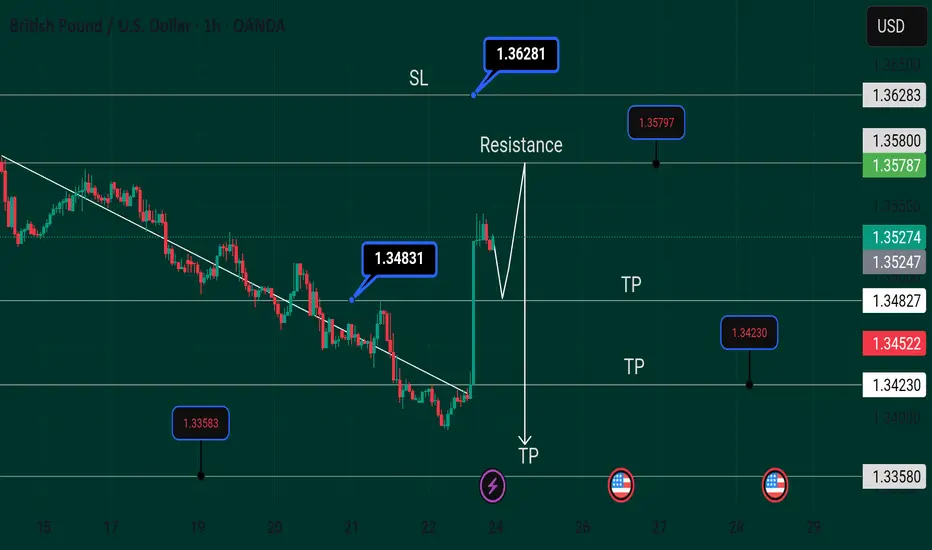
The Relative Strength Index (RSI) indicator on the 4-hour chart edges higher but remains below 40, suggesting that GBP/USD's bearish bias remains intact despite the latest recovery attempt.
On the upside, the 100-period Simple Moving Average (SMA) and the 200-period SMA form a strong resistance area at 1.3425-1.3440 before 1.3460 (Fibonacci 50% retracement of the latest downtrend) and 1.3500 (static level, round level, 50-period SMA).
Looking south, support levels could be seen at 1.3400-1.3390 (static level, Fibonacci 38.2% retracement), 1.3330 (static level) and 1.3300 (Fibonacci 23.6% retracement).
Disclaimer
The information and publications are not meant to be, and do not constitute, financial, investment, trading, or other types of advice or recommendations supplied or endorsed by TradingView. Read more in the Terms of Use.
Disclaimer
The information and publications are not meant to be, and do not constitute, financial, investment, trading, or other types of advice or recommendations supplied or endorsed by TradingView. Read more in the Terms of Use.
