Timeframe: 1-Day and Weekly Charts
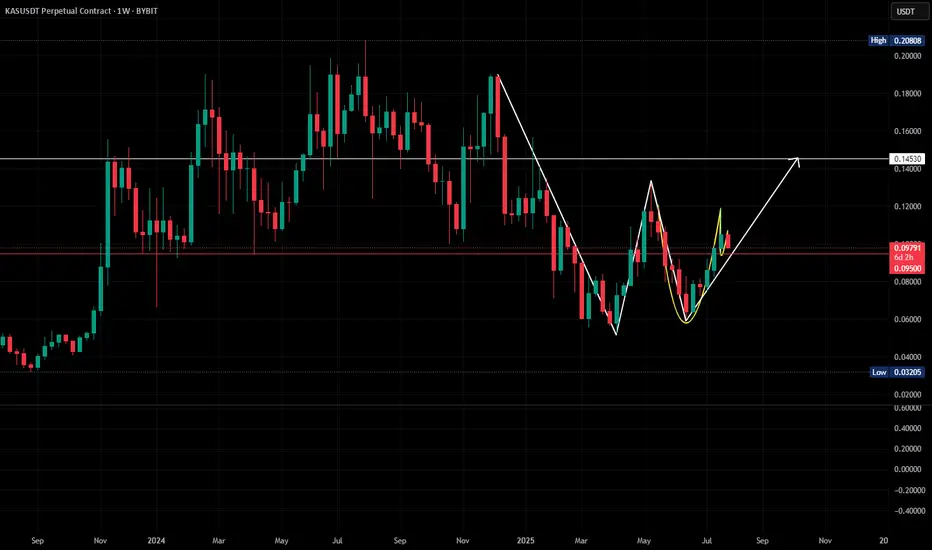
Current Price: $0.097946 (as at July 29, 2025)
Pattern Analysis:
Weekly Chart: Potential double bottom pattern with lows at $0.0527 and $0.0545, and neckline resistance at $0.098995. Current price of 0.0979 [as at 29th July 2025] is testing this neckline. A breakout above $0.0990 with strong volume confirms the pattern, targeting $0.1453.
1-Day Chart: Cup and handle formation in progress. Handle resistance at ~$0.107196, support at ~$0.098851. A breakout above $0.107 could signal bullish continuation.
Trade Idea:
Entry: Enter long position on a confirmed breakout above $0.0990 (weekly neckline) with strong volume.
Target: $0.1453 (calculated from double bottom height added to neckline).
Stop Loss: Place below $0.0950 to limit downside risk.
Risk-Reward Ratio: ~1.95:1.
Action: Monitor for a close above $0.0990 with high volume to confirm entry.
If price falls below $0.0950, reassess for potential invalidation of the bullish setup.
Disclaimer
The information and publications are not meant to be, and do not constitute, financial, investment, trading, or other types of advice or recommendations supplied or endorsed by TradingView. Read more in the Terms of Use.
Disclaimer
The information and publications are not meant to be, and do not constitute, financial, investment, trading, or other types of advice or recommendations supplied or endorsed by TradingView. Read more in the Terms of Use.