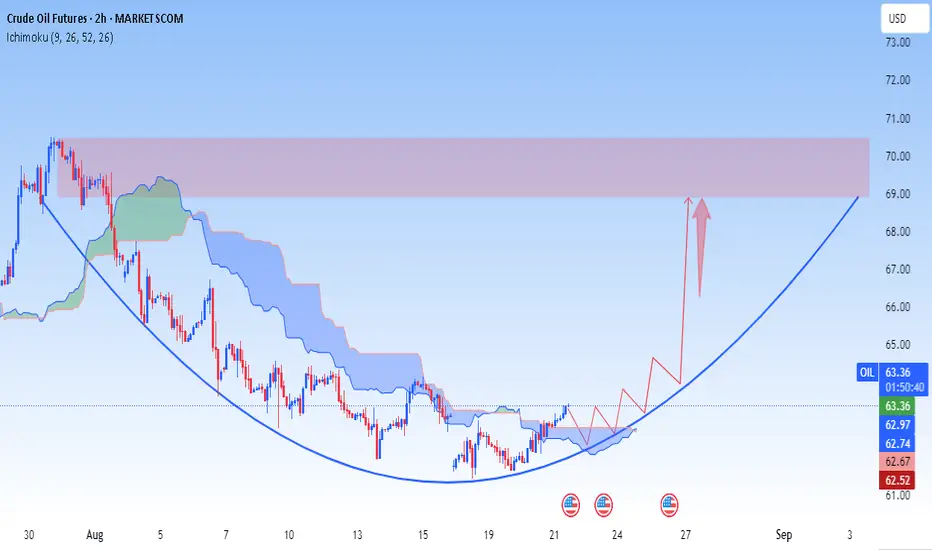
This chart is showing a Cup Pattern (Cup Formation / Rounded Bottom) on Crude Oil Futures (2H timeframe).
It signals a possible bullish reversal after a downtrend.
---
🎯 Target:
Immediate Target: $67 – $69 zone (highlighted resistance area on your chart)
Extended Target (if breakout holds): $71 – $72
---
🛑 Stop Loss:
Conservative Stop Loss: $61.50 (recent swing low)
Aggressive Stop Loss: $62.70 (below short-term support)
---
📌 Support Levels:
$62.70 (near-term support)
$61.50 (major support / swing low)
📌 Resistance Levels:
$66.00 – $67.00 (first resistance)
$69.50 – $71.00 (major resistance zone, target area)
---
✅ Summary for Clients:
Crude Oil Futures are forming a Cup Pattern, which indicates bullish momentum. As long as price holds above $62.70 – $61.50, the upside target is $67 – $71.
✅JOIN FREE TELEGRAM
✅t.me/+atTT3a4htZ8yZjQ0
✅DAILY 3-4 SIGNALS
✅ALL PAIRS CRYPTO & GOLD
✅t.me/+atTT3a4htZ8yZjQ0
✅DAILY 3-4 SIGNALS
✅ALL PAIRS CRYPTO & GOLD
Related publications
Disclaimer
The information and publications are not meant to be, and do not constitute, financial, investment, trading, or other types of advice or recommendations supplied or endorsed by TradingView. Read more in the Terms of Use.