OIL fell sharply, opportunity for upside target of 70$OIL fell sharply and has now been in a contraction for a while, I am taking it into account for a potential breakout, as it shows tightening price action, which reflects market indecision.
Price action has now coiled into a symmetrical triangle, this is often a classic continuation or reversal patte

Oil and orasiaConsidering the global oil chart and the twelve-day war in the Middle East, and looking at the global gold chart, the estimates of micro and macro investors indicate a decrease in regional tensions and an end to the war, and there is likely to be a further decline in gold and oil prices.
Hussein M.

OIL Price Forecast – Bearish Outlook OIL Price Forecast – Bearish Outlook
Oil prices have entered a consolidation phase, showing contracted price action—a classic sign of market indecision or a build-up before the next move.
This range-bound behaviour typically precedes a breakout or breakdown.
Given recent global supply-demand dyn

|Symmetrical Triangle| Squeeze in Crude OilCrude oil is currently forming a symmetrical triangle pattern, a classic squeeze formation with price compressed into a tight range. Symmetrical triangles typically act as continuation patterns, favoring the prevailing trend, and in this case, on the daily chart, the trend is well established: a bul

LCrude Oil: Bearish Pressure as Brazil Emerges as an Energy PHLCrude Oil: Bearish Pressure as Brazil Emerges as an Energy Powerhouse
By Ion Jauregui – Analyst at ActivTrades
LCrude (Ticker AT:Lcrude), which replicates the West Texas Intermediate (WTI) futures contract, has been one of the most volatile assets in 2025. It faces mounting pressure from a growin

OIL SELL activated so there oil news on more production to be made tomw or saterday either way the market will flood with oil slamming the price to the floor and introduceing a perfect levraged short

Crude Oil - Major VolatilityDue to what we are seeing between the US, Israel, and Iran - Oil prices have experienced heightened levels of volatility.
Since September '23, Oil has respected a clear series of lower highs, with each touch of the orange trendline marked by a red X. Every attempt higher has been faded — and nothi

Positive market: OIL rises sharply - Important area to watch forThe recent escalation of tensions in the Middle East has had a strong ripple effect across all commodities market. Just as we observed with Gold, it’s no surprise we’ve seen oil prices climb as well, given this uncertainty.
If you’ve seen my latest Gold analysis, you’ll understand how market senti

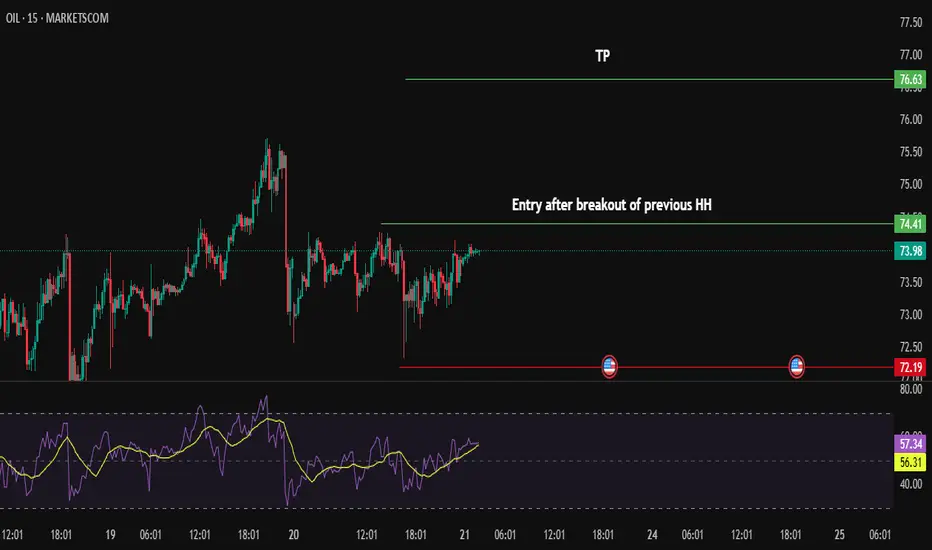
6/16/2025 3:33am PST - PreMarket Analysis - ChatGPTCRUDE OIL FUTURES – 15-Min Chart Analysis (June 16, 2025 – 06:23 UTC-4)
Ticker: OIL (MARKETSCOM)
Current Price: ~$70.97
Trend: Short-term bearish correction after major rally
EMA Signals: Bearish pressure building below 21 EMA, 50 EMA, and at 200 EMA support
🔍 Technical Indicator Summary:
1. Moving

See all ideas
Summarizing what the indicators are suggesting.
Oscillators
Neutral
SellBuy
Strong sellStrong buy
Strong sellSellNeutralBuyStrong buy
Oscillators
Neutral
SellBuy
Strong sellStrong buy
Strong sellSellNeutralBuyStrong buy
Summary
Neutral
SellBuy
Strong sellStrong buy
Strong sellSellNeutralBuyStrong buy
Summary
Neutral
SellBuy
Strong sellStrong buy
Strong sellSellNeutralBuyStrong buy
Summary
Neutral
SellBuy
Strong sellStrong buy
Strong sellSellNeutralBuyStrong buy
Moving Averages
Neutral
SellBuy
Strong sellStrong buy
Strong sellSellNeutralBuyStrong buy
Moving Averages
Neutral
SellBuy
Strong sellStrong buy
Strong sellSellNeutralBuyStrong buy
Displays a symbol's price movements over previous years to identify recurring trends.