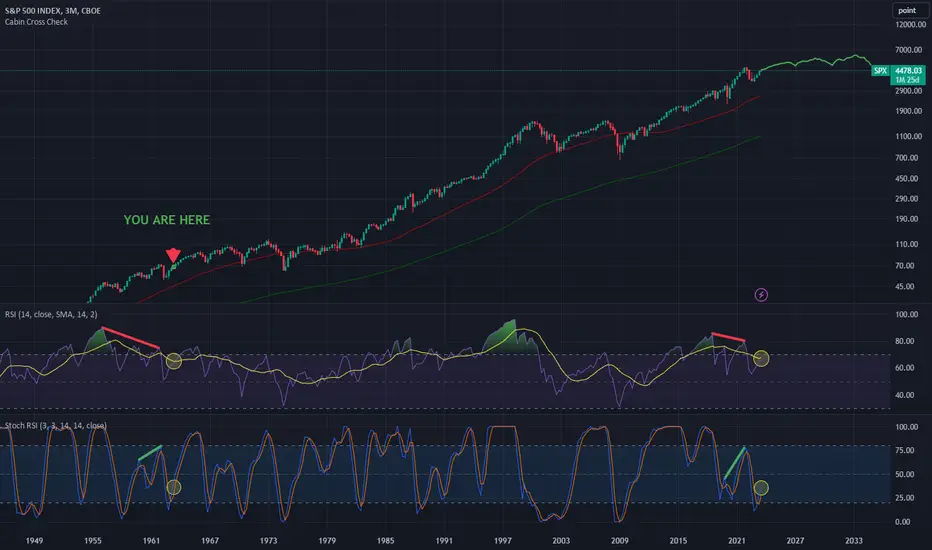
Looking at the 3 month chart of SPX, I had always been fascinated by the technicals when peeking the RSI & Stochastic RSI on such large and monumental timeframes
I made this chart interactable so you can zoom in & look at April 1963 & see how today's market setup on the S&P 500 could be very similar
Now let's go back in time for a brief moment...
JFK's BEAR MARKET OF 1962:
In 1962, as seen on the chart, the markets went thru a correction, on fears of rising interest rates, a tightening of credit, and concerns about the state of the economy. One of the major contributors to the crash was the Federal Reserve's actions to combat inflation by increasing interest rates.
Additionally, there was growing unease over the ongoing Cold War tensions and geopolitical uncertainties.
364 Days after April 1962, however, markets were recovering... 3 Month RSI had a golden cross, Stochastic RSI also crossed upward & bullish!
In today's markets... we had a similar story in 2022!
In 2022, markets corrected on fears of rising interest rates to combat inflation, a tightening of credit, and concerns about the state of the economy
The interest rate hikes in 2022 led to the correction & eventual market bottom in October 2022
It's not a coincidence that the 4th 3 month candle is also green like the last few. With almost the EXACT SAME RSI & Stochastic RSI setup
Now, if this technical pattern repeating itself holds to be true (I must emphasize this is JUST A THEORY)
The SPX WILL continue rallying 30% between today & January 2026... putting the S&P 500 at 6000!!!
A soft landing, inflation going away & strong economy will lead to a very healthy outlook for the next 900 days at minimum.
Even after any correction at that point in time. We will never see SPX under 5000 ever again...
Then after coming off of a winning decade in the 2020s, I wouldn't be surprised if in the 2030s we trade between 5000 & 6000 with minimal returns over a 10 year time period. (Lost Decade 2030s?)
So far, as of how things look in the charts, I'm willing to say we will continue rallying & retest all time highs in Q4 across all major indexes
As always, let's analyze the coming data in the coming months & see how the market unfolds!!
Disclaimer
The information and publications are not meant to be, and do not constitute, financial, investment, trading, or other types of advice or recommendations supplied or endorsed by TradingView. Read more in the Terms of Use.
Disclaimer
The information and publications are not meant to be, and do not constitute, financial, investment, trading, or other types of advice or recommendations supplied or endorsed by TradingView. Read more in the Terms of Use.