S&P 500 to 10,000 inside the next 4 years - December 2025** This is an outlook for the next 3 to 4 years **
** The bull market is not yet done, sorry bears **
Yes, read that right, 10,000 or 10k for the S&P 500.
The markets shall continue to grind higher during this 10-year bear market everyone is talking about.
Upwards and onwards for investors as u
S&P 500 Index
No trades
About S&P 500 Index
Standard and Poor's 500 Index is a capitalization-weighted index of 500 stocks. The index is designed to measure performance of the broad domestic economy through changes in the aggregate market value of 500 stocks representing all major industries. The index was developed with a base level of 10 for the 1941-43 base period.
Related indices

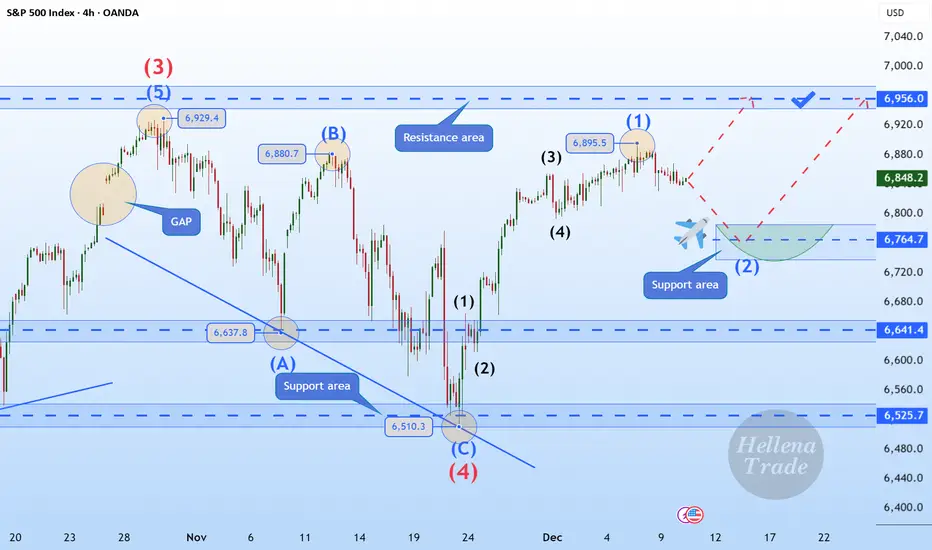
Hellena | SPX500 (4H): LONG to the area of 6956.Hello, colleagues!
I previously published a forecast for an upward movement, and I believe it is time to update the plan slightly. The direction of movement remains the same, but wave “1” has lengthened, which means that the correction in wave “2” may occur slightly higher than previously.
I expec
The Retail Trend-Following MythThe Illusion of Simple Profits: A Quantitative Analysis of Moving Average Trend Following Strategies and the Gap Between Retail Mythology and Institutional Reality
The proliferation of retail trading education has created a widespread belief that trend following through moving average crossover sy

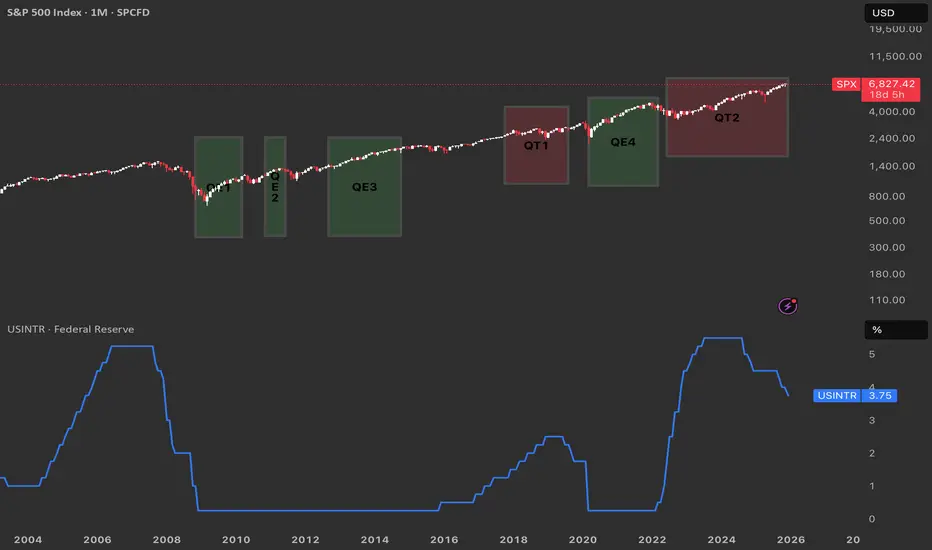
From QE to QT. Reading the Fed’s Cycle from the ChartQuantitative Easing (QE) is when the Federal Reserve buys large amounts of Treasuries and mortgage‑backed securities to expand its balance sheet, inject liquidity, and push interest rates lower across the curve.
Quantitative Tightening (QT) is the opposite: the Fed allows its bond holdings to
S&P 500 Breakdown Alert — Rising Wedge Reversal in Play!Today I want to share an S&P 500 index( SP:SPX ) analysis, as this index plays a major role in guiding correlated markets—especially crypto, and particularly Bitcoin( BINANCE:BTCUSDT ).
The S&P 500 index entered the Potential Reversal Zone(PRZ) and resistance zone($6,902_$6,875), where it began to

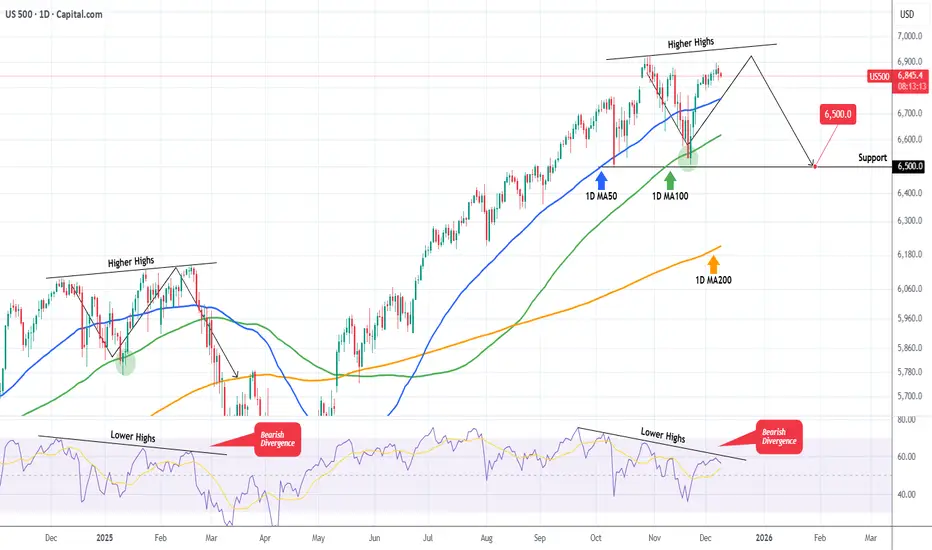
S&P500 The Bearish Divergence that may spoil the party.S&P500 (SPX) is extending a strong rally following the rebound on its 1D MA100 (green trend-line) almost 3 weeks ago. As we pointed out in a previous analysis, the price action of the past 2 months has been identical to the pattern after November 19 2024.
We are currently on the same 1D MA100 rebou
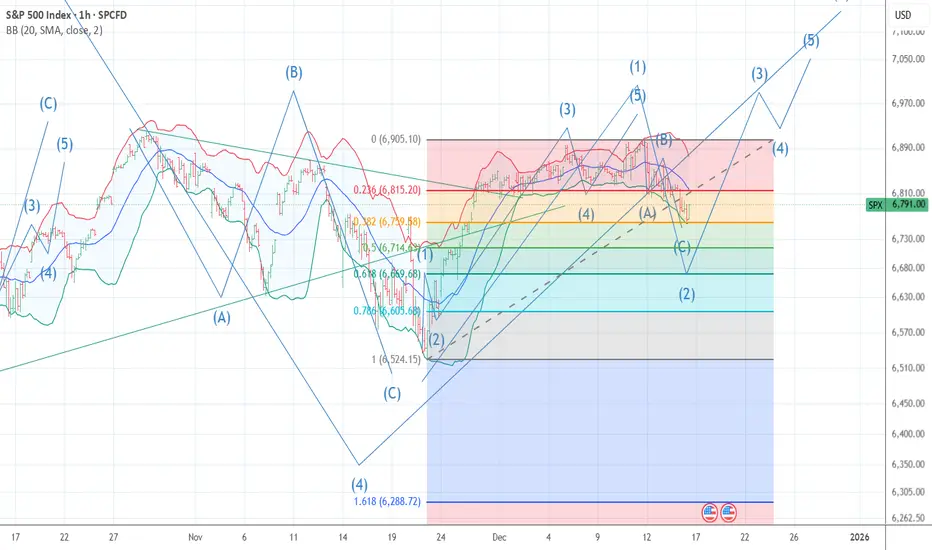
US500: Beware of a Possible DowntrendUS500: Beware of a Possible Downtrend
US500 found a strong resistance area near 6920, as we can see the price reacting quickly. There is a high possibility that we will have a strong resistance area near the top of the structure, which could push the price back down to the bottom of a larger corre

More upside again for SPX500USDHi traders,
Last week SPX500USD started the correction down to fill the Weekly bullish FVG just as I've predicted.
Next week we could see the correction finish inside the bullish Weekly/ Daily FVG (confluence 38.2 fib retrace) and after it could go up again.
Let's see what the market does and re

SP 500 abc decline has ENDED wave a=c to a .382 pullback 3 UPThe chart posted is the sp 500 I am calling the decline as Over and wave 3 up to start waves and c are equal and the drop was .382 > I now look for the santa rally to start in wave 3 up it should be .618 of wave 1 wave 3 should now see 6996 plus or minus 5. best of trades WAVETIMER I am NOW l
Be careful with S&P500 !!!The price can form a head and shoulders pattern. If that is happen, expect a significant price increase.

See all ideas
Summarizing what the indicators are suggesting.
Oscillators
Neutral
SellBuy
Strong sellStrong buy
Strong sellSellNeutralBuyStrong buy
Oscillators
Neutral
SellBuy
Strong sellStrong buy
Strong sellSellNeutralBuyStrong buy
Summary
Neutral
SellBuy
Strong sellStrong buy
Strong sellSellNeutralBuyStrong buy
Summary
Neutral
SellBuy
Strong sellStrong buy
Strong sellSellNeutralBuyStrong buy
Summary
Neutral
SellBuy
Strong sellStrong buy
Strong sellSellNeutralBuyStrong buy
Moving Averages
Neutral
SellBuy
Strong sellStrong buy
Strong sellSellNeutralBuyStrong buy
Moving Averages
Neutral
SellBuy
Strong sellStrong buy
Strong sellSellNeutralBuyStrong buy
Displays a symbol's value movements over previous years to identify recurring trends.
Frequently Asked Questions
S&P 500 Index reached its highest quote on Oct 29, 2025 — 6,920.34 POINT. See more data on the S&P 500 Index chart.
The lowest ever quote of S&P 500 Index is 2.73 POINT. It was reached on Jun 1, 1877. See more data on the S&P 500 Index chart.
S&P 500 Index value has decreased by −0.85% in the past week, since last month it has shown a 2.16% increase, and over the year it's increased by 12.15%. Keep track of all changes on the S&P 500 Index chart.
The champion of S&P 500 Index is NASDAQ:SNDK — it's gained 497.01% over the year.
The weakest component of S&P 500 Index is NASDAQ:TTD — it's lost −72.43% over the year.
S&P 500 Index is just a number that lets you track performance of the instruments comprising the index, so you can't invest in it directly. But you can buy S&P 500 Index futures or funds or invest in its components.
The S&P 500 Index is comprised of 503 instruments including NASDAQ:NVDA, NASDAQ:AAPL, NASDAQ:GOOG and others. See the full list of S&P 500 Index components to find more opportunities.