CL


Clear Channel BacktestWorking with channels to look at things, you can see that sharp movement on friday afternoon backtested the mini bear channel we were in, still have a second bear channel to pass thru.

Long Nasdaq and long CrudeNasdaq strong channel support, needs to hold here.
Oil on strong support as well.
Note how both candle bodies are large and far outside lower bollinger band on the 4 hour.
This implies by consequence that DXY or USD is about to tank.


CL breakdown continues powerfully, big Daily levels in sight nowUpdate to a previous post I made about the CL level breakdown.
Bias remains short until proven otherwise. Flat, no clear entries for me until tomorrow morning when we look at premarket price action and range.
Yesterday's trade posted to twitter. 11.25R despite mismanaging the hell out of it.
It's imperative you learn to take wholesale entries, understand context, and know when to pull the trigger and when to HAPPILY stand aside.

D1 bias, H1 setup, short term executionI'll post my Ninjatrader charts for trade entries. This is the kind of setup I want to wait for vs fighting the grind on NQ today.
I'm a momentum trader, and momentum comes from traps and/or tipping points. I don't want price to ever come back to my entry and I don't believe in wide stops.
Before taking entries, ask yourself about the market state. Is it grinding? If so, you're going to get killed with constant retests of your entries, general noise etc. What's the point getting into a position you think is going to be retested (I'm speaking as a daytrader, not a swing trader...).
If you're getting stuck overtrading, ask yourself this:
Do I really expect this trade to move to my target?
If there's a preceding trap AND contraction AND empty space ahead of you...that's where the money's made.

Bullish CL Crude Oil Swing TradeIn January of this year, a clear and well-respected swing zone began to form. The bottom of this zone held very strong support yesterday and today, and broke clean through the top of the zone today. I see a good entry in a potentially very high upside trade. There is a resistance zone from ~$70.80-71.80, so my soft target is right below that zone. However, I am not setting a limit order and will wait a day or two as we approach and react to that zone. I want to allow this trade to run and hopefully see new yearly highs.
Reversal daily candle in the resistance zone will be a signal to sell. RSI entering overbought will be one signal to sell.
Entry: $67.59
Stop (break of strong support zone): $65.30
Target (before next zone): $70.49


Buy oil they said you will be rich!LIELooks like ocmpleted elliot wave with bear divergence
68.92
66 first target
50

Cl Crude Oil Unclear, Potentially Ready To Finish 5th Wave DownCrude might be on wave 4 ready to dump down to the fib extension that matches with a prior naked point of control region.
However, it's not clear that wave 5 has started yet. It really could do anything, however it if does dump down then I will not be looking for shorts below the target region until after a correction up.

Crude looks bearishClues
(1) ascending wedge in downtrend is bearish (but agreeably the next major trend is bullish)
(2) price where a large resistance line exists and a former support line is now acting as resistance
I think it would be wiser to wait and buy when price goes back down to the stronger trend support line (in black).
That said, any short position here should have a tight stop.
Bear
Here is how I envision the short trade to go if you were to take it right now.
Bull
Here is the bullish case - buying the breakout retest.

CRUDE OIL WAVE 3 SETUP Assalamualaikum & Hi Traders!
Key level = 75.27
We are tracking a recognizable setup of wave 3 on crude oil.
Bounce in price for wave (2) is already at 50% fibonacci level compare to wave (1) (declining impulsive movement from 75.27).
Breaking 67.80 will give us indication that wave (2) is already in place.
As for now, my personal view is bias to the downside and key level = 75.27 must hold for this wave 3 bearish idea.

Does the uptrend continue?If MPP (S1) functions as a support line, think long.
The first limit is 70.00
The second limit is under MPP (P) 70.77
The third limit is under YPP (R2) 72.62
I would be grateful if you like it idea,give me follow or agrees!
------------------------- --------------------------
Brown thick line: Yearly Pivot Points (YPP in the text)
Light blue thick line: Monthly Pivot Points (MPP in the text)
Green thin line: Weekly Pivot Points (WePP in the text)
Indigo thick line: Horizontal line or Trend line seen by weekly or monthly
Indigo thin line: Horizontal line or Trend line seen by 4hourly or daily
Indigo dotted line: outstanding round number.
Red thick line: Untrustworthy line for me
Red curve: EMA 20 close
Indigo curve: EMA 200 close
Green curve: EMA 800 close
Black curve: EMA 1600 close
x mark: Line which may not function
------------------------- --------------------------

CL 8h potential for an upside bounceAfter the hard fall down, price is now coming back to balance.
The yellow Centerline will be tested. From here a natural turn is highly possible.
Additionally there is also a Pivot-Support that helps the CL holding up price.
P!

$65 is our Downside Target in CrudeOn Monday CL sold off hard and we landed perfectly at our high volume area at $68. The next such target is $65 and now that we have turned bearish I'm looking at a sell-off into that level.

Crude Oil - Poised for Short-Term LossesBig move down in Crude, on reports Libya is reopening some ports,
trade war fears, and possibility of the US allowing some country exemptions to Iran’s
oil sanction driving price drop.
Look for 71.00 to hold as resistance for a push towards 70.00 intially.

Possible Long From Support In August WTI Crude (CL)If there has been such a large one week draw on supply, then why are WTI prices heading south? The big reason is news out of Saudi Arabia. Production for June spiked significantly, upwards of 500,000 barrels per day. Traders have latched on to this piece of news, predicting a glut of oil to hit the market in coming months.
As a result, we may get a shot to take a long from support on the daily time frame. Here it is:
1)Entry: Buy $70.91
2)Stop Loss: $70.44
3)Profit Target: $71.38
4)Risk Vs Reward Ratio: 1/1
This trade is a bit of a home run, as the stop loss is considerable. Keep a close eye on your leverage. The time table for this play is extensive, so it will stay on the board until the Friday close.


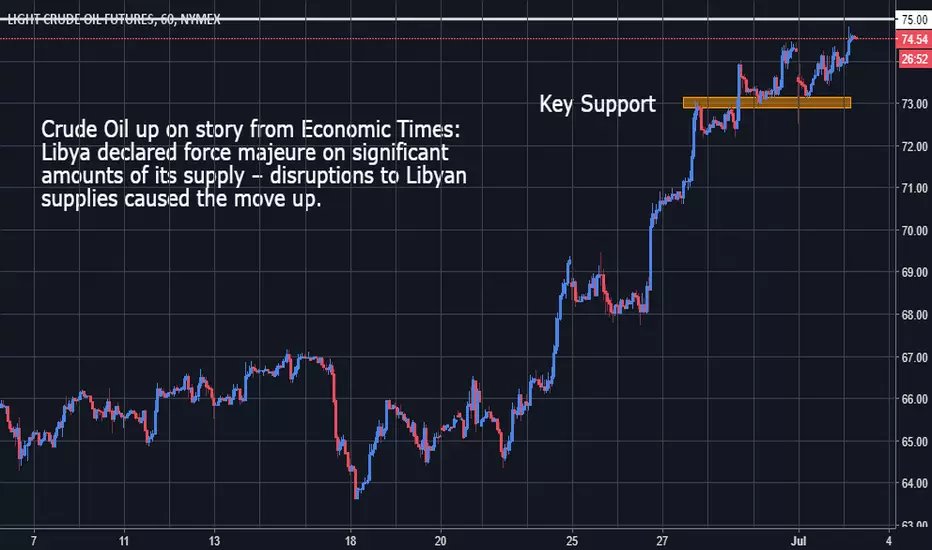
Crude Oil - Libya keeps the bias intactCrude Oil up on story from Economic Times: Libya declared force majeure on significant amounts of its supply – disruptions to Libyan supplies caused the move up.
We are approaching the first targets for the week, and support should come in around 74.00.
CL_WTI_ The price of crude will rise after the opec summitWe await the summit statement.
Expected a return of the WTI to 68.50

WTI Crude ABCD Bear CL had some nice price action this week to complete required fib level for leg C of an AB=CD pattern.
See the chart for details but its pretty straight forward. We have room to test the 67.70 price point but that just pushed the target price further down.
GLTU!
