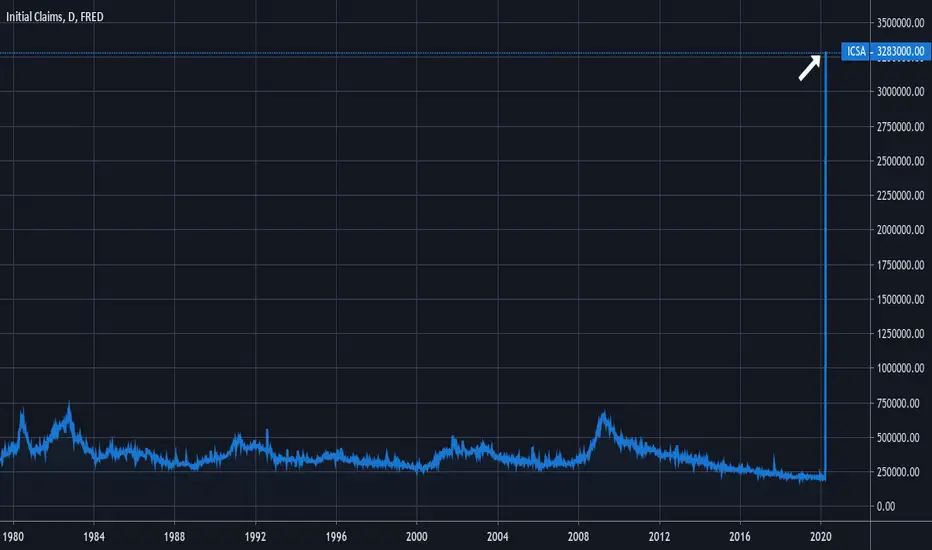
How To Chart Economic Data Like Jobless Claims or GDPCharting economic data can help you learn more about the macro world and see the bigger picture. This chart shows weekly Initial Jobless Claims in the US. In other words, it shows you how many people are filing for unemployment each week. The big spike, which has never been seen before in economic history, shows what the COVID-19 slowdown did to the economy in just one week. It is unprecedented.
You can chart Jobless Claims and much more. To get started, open a chart, go to the search box, open the dropdown menu, and then find the tab furthest to the right of the drop down called Economy. In this area, you will find many different types of economic data that you can chart from GDP to ISM and more. Most of the data comes from FRED and is US related, but please write us in the comments if you want to see other forms of data.
We hope you enjoyed this quick chart and tutorial and we look forward to sharing more! Press like if you enjoyed it or please comment below to share your thoughts.
Trading Tools
Commitment of traders reportWHAT IS IT
The Commitment Of Traders (CoT) is a report issued by the Commodity Futures Trading Commission (CFTC) , one of the most important trading insitutionsof the American government. The report has the purpose of transparently showing market dynamics to the all the people involved or interested in the matter.
The COT report show all currently open positions (open interest) of the future and options market, where 20 or more traders hold positions for an amount greater or equal to the minimum amount amount established by the CFTC .
The report is issued every Friday at 3:30 P.M. (Eastern Standard Time, hence UTC-5). Each report normally contains data until previous Tuesday. CFTC usually receives data on Wednesday morning from the reporting firms (i.e.: Future Commission Merchants, Financial Insititutions, Brokers or International Stock Exchanges). After some verifications, CFTC publish data the following Friday. For each market, data are provided in terms of existing (still open) LONG and SHORT positions.
TYPES OF REPORTS
There are 4 types of report:
1) Legacy
It contains data split by stock exchange. This report has two different variants: "futures only", that contains data related to the futures market only, and "combined", that contains aggregated data for futures and options market. All the reported positions in this report are split in two main market actors categories: Commercials (or Large Speculators) and Non-Commercials
2) Supplemental
It includes contracts related to 13 selected agricultural market commodities. This kind of report split positions in 3 market actors categories: Commercials (or Large Speculators), Non-Commercials and Index Traders. Differently from Legacy report, the Supplemental is provided in the "combined" format only, hence contains data for both futures and options market
3) Disaggregated
This report contains the same data issued in the Legacy report, but with a more detailed drill down in terms of representation. First of all, it presents data split in 5 macro-categories: Agriculture, Petroleum and Products, Natural Gas and Products, Electricity, Metals and Other. Moreover, the report shows open positions/interests of 4 market actors categories: Producer/Merchant/Processor/User, Swap Dealers, Managed Money e Other Reportables. Aggregating data of this report, it is possible to obtain same data of Legacy report, hence this is a detailed view of data contained in the Legacy report. The Disaggregated, as well as the Legacy one, is available as "futures only" and "combined" variants
4) Traders in Financial Futures (TFF)
This report includes contracts related to currencies, US Treasury Bonds, Eurodollar deposits, VIX shares and Bloomberg Index only. The reports shows open interests of 4 market actors categories: Dealer/Intermediary, Asset Manager/Institutional, Leveraged Funds e Other Reportables. Last, also this report is available as "futures only" and "combined" variants
REPORT FORMATS
Legacy and Disaggregated reports are provided in two formats: short (synthetic) and long (extended). Both these formats contain same data, but long format contains also the concentration of open positions in the hands of the major 4 and 8 market investors at the moment of data collection, while short format does not contains any data about concentration.
TFF report is available in long format only, while the Supplemental is available in the short format only.
Report type Scope Format
Futures Combined Long Short
Legacy ✓ ✓ ✓ ✓
Disaggregated ✓ ✓ ✓ ✓
TTFF ✓ ✓ ✓ X
Supplemental X ✓ X ✓
Legacy report
As said above, market actors in Legacy report are divided in 2 categories:
Non-Commercials , or Large Speculators : they are market speculators as well as hedge funds. This category normally uses financial leverage to amplify variation of derivative asset and has an aggressive behavior in the market. They use rigid stop loss policies and, when the market falls below certain levels, they reverse positions on the other side. The main purpose of Large Speculators is not the asset they buy or sell, but to obtain a net profit from the buy/sell cycle. They normally have a trend following behavior.
Commercials buy futures just because they are interested in the underlying asset and try to hedge their financial exposition related to the commercial activity with the assets they are interested in. These market actors hold more than 50% of open positions in the US futures market and normally they go against the price trend: they sell when the market goes higher and they buy when the market goes lower. Their positions on underlying assets normally anticipate market trend, hence they should be carefully monitored
Non-Reportable : are the open position of small investors/traders that normally are on the wrong side of the market. This investors category is usually confused and not disciplined. They do not follow precise rules and are usually dragged by the trend, but they are slow to reverse positions when the market trend reverses.
The following example contains data about "futures only" market for BUTTER, coming from Chicago Mercantile Exchange.
BUTTER (CASH SETTLED) - CHICAGO MERCANTILE EXCHANGE Code-050642
FUTURES ONLY POSITIONS AS OF 03/17/20 |
----------------------------------------------------------------------------------| NON-REPORTABLE
NON-COMMERCIAL | COMMERCIAL | TOTAL | POSITIONS
--------------------------------|---------------------|--------------------------|-----------------
LONG | SHORT |SPREADS | LONG | SHORT | LONG | SHORT | LONG | SHORT
--------------------------------------------------------------------------------
(CONTRACTS OF 20,000 POUNDS) OPEN INTEREST: 11,597
COMMITMENTS
0 2,473 453 10,401 8,149 10,854 11,075 743 522
CHANGES FROM 03/10/20 (CHANGE IN OPEN INTEREST: 753)
0 -127 101 675 796 776 770 -23 -17
PERCENT OF OPEN INTEREST FOR EACH CATEGORY OF TRADERS
0.0 21.3 3.9 89.7 70.3 93.6 95.5 6.4 4.5
NUMBER OF TRADERS IN EACH CATEGORY (TOTAL TRADERS: 47)
0 12 10 28 22 38 34
It is possible to see as in the report is provided the total amount of LONG and SHORT positions for Non-Commercial, Commercial and Non-Reportable actors. Variations from previous week are moreover reported.
In addiction to LONG and SHORT positions, Legacy report contains also the SPREAD amount, that is available for Non-Commercial only, and refers to contracts that are opened LONG and SHORT at the same time. Normally a growing SPREAD value means a high level of uncertainty.
If we calculate NET POSITIONS (NP) for the 3 actors categories, as it's easy to check, the report show a zero-sum scenario:
NP Non-Comm = 0 – 2,473 = - 2,473
NP Comm = 10,401 – 8,149 = 2,252
NP Non-Rept = 743 – 522 = 221
NP Non-Comm + NP Comm + NP Non-Rept = -2,473 + 2,252 + 221 = 0
OPEN INTEREST value is the grand total resulting as the sum of LONG, SHORT and SPREAD positions:
Open Interest = 0 + 453 + 10,401 + 743 = 11,597
Supplemental report
Even the Supplemental report (called also Commodity Index Traders - CIT) shows data in the same manner of Legacy report, but the market actors are 3: Non-Commercial, Commercial and Index Traders.
Non-Commercial and Commercial actors are the same, while Index Traders category has appeared for the first time in January 2007. Before that date, investors that are now reported in this category were scattered in the two existing categories (Non-Commercial and mostly in the Commercial). The creation of Index Traders category has had the purpose to separate that category from Commercials, because Index Traders are not involved in the buy/sell cycle of underlying assets, and are usually managed funds, institutional investors or swap dealers. Index traders are normally interested in passive and longstanding LONG positions, while are not interested in the short-term price fluctuations. It's not unusual that this category start buying when price is falling and technical analysis says that the price falling will be even more deep. Index Traders are hence a counter-part of speculators, who have usually a contrarian habit.
Supplemental report is provided for 13 commodities:
• WHEAT-SRW - CHICAGO BOARD OF TRADE
• WHEAT-HRW - CHICAGO BOARD OF TRADE
• CORN - CHICAGO BOARD OF TRADE
• SOYBEANS - CHICAGO BOARD OF TRADE
• SOYBEAN OIL - CHICAGO BOARD OF TRADE
• SOYBEAN MEAL - CHICAGO BOARD OF TRADE
• COTTON NO. 2 - ICE FUTURES U.S.
• LEAN HOGS - CHICAGO MERCANTILE EXCHANGE
• LIVE CATTLE - CHICAGO MERCANTILE EXCHANGE
• FEEDER CATTLE - CHICAGO MERCANTILE EXCHANGE
• COCOA - ICE FUTURES U.S.
• SUGAR NO. 11 - ICE FUTURES U.S.
• COFFEE C - ICE FUTURES U.S.
Disaggregated report
Market actors of Disaggregated report are:
Producer/Merchant/Processor/User : they are involved in production, handling, packaging or transport of physical assets that is underlying to the future instrument or option. These actors use futures to cover/hedge risks associated to the activities they are involved in that are strictly related to the production of the assets
Swap Dealers : they are subjects that are involved in trading swap contracts related to the commodity and uses futures market to cover/hedge risks associated with swap transactions. The counterpart of a Swap dealer could be a speculative traders, as well as an hedge fund, or a more traditional Commercial subject that is interested in managing risks associated with the commerce activities of the asset
Money manager : to this category belong Commodity Trading Advisor (CTA), Commodity Pool Operator (CPO) or an unregistered fund identified by the CFTC. These subjects are delegated from their clients to do financial operations in their behalf
Other Reportable : all speculative traders that are not belonging in the three previous category are included in this category
Even in this case, the report shows LONG, SHORT and SPREAD positions.
Comparing this kind of report with Legacy, we can see that:
COMMERCIAL = PRODUCER/MERCHANT/PROCESSOR/USER + SWAP DEALERS
NON-COMMERCIAL = MONEY MANAGER + OTHER REPORTABLE
This explains why the report is called "disaggregated". It shows the same data but with a more level of detail especially regarding the actors that hold open positions.
If we take the Disaggregated report about BUTTER for the "futures only" market coming from Chicago Mercantile Exchange (equivalent to the previous example that is showed under the Legacy report section, we see:
:------------------------------------------------------------------------------------------------------------------------------------------------------ :
: Producer/Merchant : : : :
: Processor/User : Swap Dealers : Managed Money : Other Reportables :
: Long : Short : Long : Short : Spreading : Long : Short : Spreading : Long : Short : Spreading :
--------------------------------------------------------------------------------------------------------------------------------------------------------
BUTTER (CASH SETTLED) - CHICAGO MERCANTILE EXCHANGE (CONTRACTS OF 20,000 POUNDS) :
CFTC Code #050642 Open Interest is 11,597 :
: Positions :
: 8,893 6,326 1,048 1,363 460 0 301 180 0 2,172 273 :
: :
: Changes from: March 10, 2020 :
: 244 648 324 41 107 0 -12 -8 0 -115 109 :
: :
: Percent of Open Interest Represented by Each Category of Trader :
: 76.7 54.5 9.0 11.8 4.0 0.0 2.6 1.6 0.0 18.7 2.4 :
: :
: Number of Traders in Each Category Total Traders: 47 :
: 24 18 . . 4 0 . . 0 10 9 :
---------------------------------------------------------------------------------------------------------------------------------------------------------
If we take the categories Producer/Merchant/Processor/User and Swap Dealers and we sum all LONG positions and then subtract all SHORT positions, we obtain an overall NET positions like this:
NP = (8,893 +1,048 + 0 + 0) - (6,326 + 1,363) = 2,252
Now, if we do the same calculation for Commercial category of the correspondent Legacy report (see above) we obtain:
NP = 10,401 - 8,149 = 2,252
This is the confirmation that Disaggregated report contains the split of data reported in the Legacy report, where Commercial category is divided in Producer/Merchant/Processor/User and Swap Dealers. Same calculation would demonstrate that Non-Commercial category in the Legacy report is spitted here in Managed Money and Other Reportable categories.
If we now consider the Disaggregated report and we sum all LONG positions and then we subtract all SHORT positions for each actors category, we obtain:
(8,893 + 1,048 + 0 + 0) – (6,326 + 1,363 + 301 + 2,172) = 9941 - 10162 = -221
Given that the grand total should represent a zero-sum scenario, e can deduce from Disaggregated report that net position of Non-Reportable subjects should be +221, hence a net LONG of 221 contracts, and that is correct, in fact it is possible to obtain the same result from correspondent Legacy report (see above) by subtracting net SHORT position for Non-Reportable actors to the amount of net LONG positions for the same actors. Hence Disaggregated report allow us to calculato also net position of Non-Reportable, even if the data do not explicitly report the value.
Traders in financial futures report
This report is a further view on the market and split market actors in two sides (SELL and BUY) and 4 categories:
SELL SIDE
Dealer/Intermediary : are financial intermediaries who earn by the commissions related to the sell of financial products. Big banks and other financial entities are involved in this activities
BUY SIDE
Asset Manager/Institutional : they are insitutional investors, including pension funds, insurance companies and investment portfolio managers whose clients are mainly institutional entities
Leveraged funds : these are typically speculative funds (hedge funds) and various types of money managers, including the Commodity Trading Advisors (CTA) and the Commodity Pool Operators (CPO) not necessarily registered by CFTC. These subjects can be involved in hedging strategies and arbitrages on their own capital, or even third parties capital
Other reportable : these are all the traders that are not included in previous categories
Differently from Disaggregated report, the TFF report the positions of the mentioned actors categories are not an exact disaggregation of Commercial and Non-Commercial positions reported in the Legacy report. Here each actor belonging to one of the categories mentioned above could belong to the Commercial or the Non-Commercial category in the Legacy report, basing on the decision that CFTC takes during the report creation, that can be different time after time (i.e.: a subject that has already been considered a Commercial one in the beginning, can be shifted to Non-Commercial after a while, depending on the specific activities he is involved during the time, that can change as well). The TFF report is moreover available only in the LONG format
REPORT ANALYSIS
If we properly analyze data in the Commitment of Traders legacy report, we can determine the expectations of each market actor category regarding the market future.
The possibility to know the net positions of Commercial subjects (institutional investors) is the basis to understand the market sentiment. Their influence is, in fact, between 50% and 75% of the entire futures market of S&P500 and from 40% and 60% of Nasdaq100.
It is useful to point out that Commercial subjects, as well as the Non-Commercial, can take arbitrage or hedging positions, or, alternatively, put in place an active management of their portfolios by buying or selling futures on foreign (not US) markets, or, again, have open position on the futures' underlying assets and protect themselves from risks of price variations by taking opposite positions on the futures market. Hence the Commitment of Traders Report is an important thermometer to measure US stock exchange sentiment, but it isn't a tool that, alone, can allow us to predict how financial markets will move. It should be used (as usual) together with other indicators, tools, analysis and perspectives to have a better understanding of what is happening and a good approximation of what is going to happen (most likely).
Commercial subjects are active actors in the futures' underlying asset market and generally sell when the market (price) grows and buy when the price is more convenient (low), hence their activities are contrarian to the logic of speculators. For this reason the Commercial actors are often responsible of market moves and trends. They drag prices and the market with their activities, hence they anticipate and determine the market trends.
Non-Commercial subjects, viceversa, have opposite interests. They want to make money by price variations, hence they buy when the market shows growing prices and sell in the opposite conditions. This behavior is what we call "trend following" approach.
Here are some typical scenarios that we can find by analyzing the Commitment of Traders report:
1) If Non-Reportable actors (small/retail traders) are LONG and Commercial are SHORT, the Non-Reportable actors are most likely going to loose money because the price will go to to the side where Commercial are pushing it (down)
2) On the maximum levels of an asset price (i.e. near significant RESITANCE levels), Non-Reportable are likely pushed to SELL their positions. Then stop loss levels are likely hit and only after the price starts his falling stage
3) If Non-Commercial are LONG and Non-Reportable are SHORT, we are likely in the middle of an UPTREND and there is more space for the price to gro further
4) If Non-Commercial are LONG and also Non-Reportable are LONG, we are likely in the "euphoric" phase of the trend, hence the trend is going to finish soon
5) If Non-Commercial are SHORT, Non-Reportable are upgrading their SHORT positions and Comemrcial slow down their LONG positions, e re likely in the terminal phase of a downtrend
If we accept the hypothesis that Commercial traders hold better information on the market than the others just because they are active actors of the futures' underlying assets (it's their own business!), it is very important to monitor their behaviour in order to understand how they are evaluating the situation related to the specific commodity that is at the center of our interest.
Commitment of Traders Index
An interesting approach to have effective insights from the Commitment of Traders report can be obtained by calculating an index using the report data. Normally Comemrcial net positions are used to calculate the index as follows:
NP (Net Position) = Long Positions – Short Positions
Usually, an interval of 26 periods (weeks) is selected and the calculation to determine the index value is:
COT Index = * 100
The index, expressed as a pecentage value from 0 to 100, reflects net position of Commercials on the basis of last 26 periods. It can be used as an indicator of overbought and oversold zones and can be a good tool to understand where investors are moving.
The index can be also calculated for Non-Commercial or Non-Reportable positions.
Last, but not least, remember that Commitment Of Traders report is released every Friday evening, but contains data up until previous Tuesday, hence a "lagging" effect should be seriously considered in all the analysis that involves it.
The content of this article has solely education purposes and should be not considered trading or investement advise.

How To Find The Correlation Coefficient For Any Two AssetsThis chart shows Bitcoin (candlestick chart) and the Correlation Coefficient between Bitcoin and the S&P 500 (white graph).
You can find the Correlation Coefficient between any two assets in seconds -- it's easy. First, head to Indicators & Strategies and then search for Correlation Coefficient. When you find it, click it, and a box will appear asking you to type in the asset you want to compare. Press Enter and the chart will calculate the correlation immediately.
Correlation Coefficients are important because they can show you how two assets are moving together. For example, are they moving in lockstep or in opposite directions? A correlation of 1 means a perfect positive correlation and a correlation of -1 means a perfect negative correlation.
We hope this quick guide helps you with your analysis. Please press like if you enjoyed it and write in the comments for other tips or tricks.

Lessons about ultimate ignorance, survivor bias, exp. growthHello,
I wanted to write about these 3 subjects, I have alot on my mind but I'll try keeping it compact and clean.
1- Ultimate Ignorance
* People are persuaded the stock market will always go up. Why? They expect to all become rich with absolutely no effort like magical money will just appear in their pockets.
Even a woldwide index isn't completely safe, global markets have dropped and stagnated for more than 100 years in the past and stock markets are only 500 years old. Concerning individual countries there has never been one that lasted forever... So it's pretty irrational as Einstein would say to expect a different outcome this time.
And money doesn't just magically grow on trees forever what are those people thinking...
They are going to learn a harsh lesson.
* Certain people are completely stupid and out of this world. I have no word. The type of person crying because Bernie is not the dem frontrunner.
One of those said, and it seemed it wasn't a troll, that "rich" bloomberg was so rich he could give every single american citizen $1 million which would change the life of most americans. And when people tried explaining how stupid that claim was, that person defended it "bla bla bla the point is he could give 1 million to every one and he wouldn't notice".
The kind of people that watch clown news network every day and believe what they say.
Even in congress alot fail basic maths taught to 6 yos. And of course they think infinite money can be printed and make every one rich. And if need money for free stuff always simple solution "just tax the rich". All of their idiotic ideas are traumatising. And on top of that it has been tried and failed.
I lost all hope for the human race...
Might be living in noisy stressful big towns making people lose their minds. We need to end wageslavery and have an exodus back to rural areas asap, but this is an idea for another post.
* 2 years ago Paul Singer (the Argentina Vulture Capitalist managing a few dozen billions in a fund) had this to say about Bitcoin in a letter sent to investors, unlike Warren Buffet he does not try to look nice and friendly not hurt anyone feelings and just says it how it is:
“This is not just a bubble. It is not just a fraud. It is perhaps the outer limit, the ultimate expression, of the ability of humans to seize upon ether and hope to ride it to the stars...
But is it not glorious that when the equivalent of nothing attracts priests and parishioners who run up the price, the very willingness of the mob to buy it at higher and higher prices is seen as validation of the thing, rather than an indication of the limitless ignorance of swaths of the human race?”
I completely agree. And like this person, I just say it how it is no point sugar coating it, Warren does it and crypto victims are still hating the guy so what is the point?
He admitted there was genius in Bitcoin, when he called it a "Brilliant scam". I completely agree.
Crypto HAS to be the ultimate never seen before super scam, the biggest ponzi in history. They can't ever have been any scam this big. Social security and debt are different so I'd count them separately. Bitcoin is one of the biggest mass delusion the dumbest the peak of human ignorance.
"The outer limit" yes, this must be it, how can it possibly get dumber?
2- Survivor bias
How ignorant are you?
Here is a little test, got this from a recent video on youtube about prediction:
This is an image extracted from the damaged planes the air force has in their hangar (I think it was the RAF but it doesn't matter):
Command wants to armor the plane. Where should they place the armor? (can't full armor the plane makes it heavy and costs money & a nation cannot print or tax itself into wealth)
The red areas represent where the planes took bullets on average.
Well what does this tell us?
It tells us that the planes in the hangars have this composite.
In other words, the planes that made it home.
I know alot of people ("just tax the rich make everything free") that would instantly say "armor the red area" but it is so wrong.
This is why natural selection favors the smartest, and why wars are won by smarter faster thinking commands (cough cough france germany ww2).
The reason why their planes had very little impacts in the mid fuselage engines and cockpit is really obvious... Those ones did not make it home.
So all they get back are the survivors... That didn't get hit in the priority areas.
Understanding survivor bias is important.
In this video it was a class lesson and about half the students gave the wrong answer. Of the other half I am willing to bet they were mostly just afraid to look stupid or sleeping.
3- Exponential Growth
The graph is a classic.
Some examples:
- Bacteria Colonies: the stagnate when food rarefies then just die of hunger/eat each other
- Virusses (Corona...)
- Internet Virusses
- Ponzi Schemes (you know one...)
- Product Life Cycle (the radio was introduced - Lag Phase, grew till every one had one, stagnated at 90% adoption or so, and has been dying with tv the internet smartphones)
- Bubbles ("back to normal" is stagnation)
- And more
What is great about maths is how you learn that everything is correlated and works the same. And add finance which also does that, your brain goes boom.
By the way, in Asia the coronavirus so many nuts are so afraid of, is in the decline phase.
In Europe and NA I think we are at stagnation phase but there has been a spike in case, probably from all the people testing for it.
What a joke. Idiocy to the limit "outer limit". Peak ignorance.
People are fighting for toilet paper. I don't even understand.
Some numbers.
Worldwide cases of CoronaHoax: 150,000. Probably a bit more with the infected people that don't even notice it LOL!
H1N1 2009 (swine flu) cases: 700,000,000 to 1,500,000,000. Half a million deaths.
There was like easilly 1 billion cases of H1N1.
It is still good that government try to limit the spread of the virus, to protect their elders.
But all these ignoramus panicking, and whining Trump didn't do enough (Obama did nothing for 1 billion infected H1N1...).
Oh and by the way an analysis was done on 1 billion infected H1N1... It was a smaller deal than the common flu THAT HAPPENS EVERY YEAR.
The pathetic little common cold known as Covid-19 (it is a common cold) is on the decline already :)
Mass hysteria over this... so this is it... Clown world. The exponential spread of idiocy is at max now right? Ah right we keep helping them out rather than let natural selection do its job so the decline won't ever happen.
"You have to be a contrarian to make money". Yup. When the herd panics "CO2" (makes so much sense) "CoronaPoop" (sad) or gets all excited "Bitcoin moon soon" (reptilian brains) you know it is time to consider thinking the opposite.
Interesting how everyone that makes money consistantly, all the big time billionaire financeers, all think the same.
90% are going to have this mob mentality to varying degrees. SHEEP. Illogical irrational ignorant sheep.
Understand how the reptilian herd behaves, profit from it, rince and repeat.
No one ever made money being a sheep (ok there were a few but they got lucky).
Always stay rational. This gets repeated so often via "do not be emotional", but those that repeat this number 1 tip do not always understand it and think it means you should avoid going completely berserk (clearly they don't trade and just repeat something they read), it means BE RATIONAL (as opposed to emotional).
And this is the 1 exception, the 1 free meal. In this case there is a very simple way (well maybe not for everyone, but simple on paper) to make alot of money.
By simply being rational you already beat 90% of the competition. It is magical.


The VIX at 50 and Using Custom Trend Line TextThis chart shows the VIX since 2018. Between now and then, two significant moves have occurred. In both instances, the VIX went as high as 50 before topping out and then dropping back down. Will that happen again today?
What's also cool about this chart is we're demonstrating our new Custom Text for Trend Line tool. You can now draw any line on your chart and then easily add text alongside that line. The line can go sideways, up, down or at an angle and the text will follow it.
To try it for yourself, open a chart and follow these steps:
1. Open your line Settings by double-clicking on the line or right-clicking and going to Settings.
2. Check the Show Text box and then type anything you want.
3. Adjust the alignment of the text of your choice.
You can read more here on the official TradingView blog: www.tradingview.com
Let us know if you have any questions or want to chime in on your thoughts about the VIX today.

Auto-delivering TradingView Alerts into MT4, MT5Check out TradingConnector (dot_com), an integration tool, which enables auto-delivery of TradingView Alerts in to MT4 and MT4, to trade Forex, commodities and indices!
Delivery time is below 1 second, so it can be even used for scalping, as well as higher timeframe trading.
Disclaimer: This is no financial advice nor any financial service. Remember – 95%+ traders lose money. You are trading at your own risk.

Introduction to the BEST Trade ManagerHello traders
Let me highlight what the BEST Trade Manager can do for you.
The Trade Manager adds another layer to your own systems, enabling custom user-defined stop-loss/take-profits and real-time analysis with risk-to-reward ratios.
We made it as such the visual rendering is also very nice on mobile devices.
Reviewing:
- How to connect your own indicator(s)
- How to read the graphical elements
- The 8 Stop-Loss options
- The 4 Take-profit options
- The alerts and dynamic alerts for trading automation
Links are in my signature for more information about it
Wishing you all the BEST for your trading using it.
Dave

Tradingview Drawing Tools (part 2)In this tutorial, we take a look at the Trend Line Tool and the Gann & Fibonacci Tools. Again, I discuss how to change the individual settings as well as how to save it as a template.

Tradingview Drawing Tools (part 1)In this tutorial, I show you where the different drawing tools are located, how to show/hide them, and how to delete them. I also begin showing you how to change their individuals settings so that they are only visible on specific time frames and how to change their individual styles.

Tradingview Timezones, Alerts, and Moving Multiple ChartsIn this tutorial, I show you the basics of changing your charts' order if using multiple charts at once, how to change your timezone, and how to setup alerts on your charts.

Tradingview Time, Chart Layout, and Candle typesIn this tutorial, I show you the basics of changing your chart's layout, time intervals, and candle types.

Tradingview Color Themes and Indicator TemplatesIn this tutorial, I show you the basics of changing your chart's color theme, including how to save and recall it. I also show you how to change the color theme of your indicators as well as how to save your indicators as a template for easy recall any time you open a new chart. This two tips will save you endless hours and help you personalize your charting experience.

MoneyButton for BTC x3 leverage tokens BULL and BEARThis script is a trigger for my DCA scalping bots

'Sharing its caring" LONGS/SHORTS/ USD JPY AUD DAIHi traders .
Time to share some of my new founding that can help you in trading scenarios . This one its gem IMO , Bag of tools with this one its pretty substantial from long, short liquidation open interest . Candle patterns . EMA SMA and list goes on guys .
Enough talks Test it yourself .
Hope you enjoy this content ,
Hit the like . Keeps me motivated to share this info with you .

BTCUSD is above the ichimoku cloud on the weekly !BTCUSD: golden cross & above ichimoku cloud on the WEEKLY.
Both happened only a few times in the price history of Bitcoin.
(blue) Sometimes it marked the BEGINNING OF BULL MARKETS.
(purple) Sometimes it was misleading, but then it did not lasted long.
Note:
I guess (not sure) that EMA 200 days translates to EMA 29 weeks, and EMA 50 days to EMA 7 weeks. Is that a correct assumption?
Happy trading!

Keep an eye on BTC in other currencies. JPY KRW BRL CADKeep an eye on BTC in other currencies, by multiplying with exchange rate.
Instead of BTCUSD type this into the chooser box:
bitflyer:BTCJPY*JPYUSD
korbit:BTCKRW*KRWUSD
mercado:BTCBRL*BRLUSD
kraken:XBTCAD*CADUSD
May this help you somehow.

Massive sequence of RSI-Renko DIVINE™ Scalps Following Iran NewsThere were a total of 250-270 points of NQ scalps after the Iran missile strikes going long. If you held the first contract long on the swing trade (1st trade in the direction of the new trend is always the swing trade, marked by a fat arrow) you would have gained another 270 points.

70%VolumeZone. An Insight Tool that few ppl know. (XAUUSD)From my backtest, this zone can be very useful in many ways.
I'm also new to this tool. Let's learn this together.
Day by day.
;)

How to Use the Baseline ChartThe chart we made today shows the price of gold as a Baseline chart. The Baseline chart shows price movements relative to a baseline that you choose anywhere from 0% (the lowest point) to 100% (the highest point).
This chart shows gold since the last 1970s with a Baseline of 50%.
Why is this interesting? The chart can show you if an asset is above or below a specific baseline over any period of time. For gold, we see it is well above its average price (50% baseline) and it's been trading above that average level for years (the line turns green when an asset is above the baseline level and red when it is below).
To start using the Baseline chart, follow these simple steps:
Step 1 - Change your chart layout to Baseline. Press the Chart Style button at the top of your chart and select Baseline in the drop down.
Step 2 - Go to your chart Settings by right clicking or double tapping on the chart line.
Step 3 - In your chart settings, find and adjust your Base Level to a percentage you want to see. This can be anywhere from 0% to 50%.
We hope you enjoyed this chart and how to use the Baseline chart to follow any asset. Please press Like if you enjoyed this tutorial or write a comment below.

Looking at short interest of some US stocks [Crowded Shorts]Hello, I have to look at some details on a FX strategy and it is alot of mental effort, therefore here I am looking at high short interest on stocks that I do not even trade :)
Let's look together at the most shorted stocks in the USA.
What I think happens in Wall Street is every one copies every one.
If a fund misses out on something that every one else has been doing, their clients will be unhappy.
If a fund loses money but every one else did too "it was a hard year so it's normal.
"We didn't do worse than the competition" and clients stay with them rather than look for another 2/20.
I would classify groups of market participants in such a way:
- sovereign funds
- pensions etc
- hedge funds
- biggest fund in the world: japan families/housewives (they are all bound to the same laws and fundamentals, they are half the reason why crypto went up I think, the other half being USDT)
- noob retail (represented via what robinhood users are doing)
- banks but not that much
- warren buffet
- entire community positions (short interest for example)
- twitter, wallstreetbets, other social networks?
First, by dollar volume:
Looking at the 2 other companies in the top 5 by % shares shorted that I didn't look at already (the 3 were match tdoc mdco):
What are all these countertrend warriors?
GM has an mcap of 50 billion (mdco is only 6 bil big for example), not in an uptrend, and it is not even in the top 150 most shorted stocks...
GE: 100 billion market cap. Not in the top 150! What can more easilly shoot up 200%? A little scooter mcap of 5 billion, or a giant cruiser ship of 100 billion?
It's not like they have 0 trading volume...
I heard in the media that wall st shorting stocks was a bearish sign but I'd rather not listen to these clowns. Maybe it was far in the past. Maybe in some cases.
Not when the whole herd does the same thing.
In the top 150 most shorted stocks I look at the ones with the lowest float % shorted:
Netflix already done, trending down
Charter com already done, going up
That's only a few examples, it would require way more study.
But looks like the very shorted ones are bad to short, just the herd brainlessly piling up, under 10% seem fine.
First impressions are that stocks shorted 5-9% might be a sign something is up, or at least it is not a reason NOT to short.
But these > 20% like Tesla are just too much.
Shorting > 30% is just asking for huge short squeeze candles and as well as gaps up.
And using options won't solve the issue of the price going up and it being a loser just because everyone else is getting margin called.
First impression was probably correct. The herd is brainlessly doing what others are doing.
Trading as a individual competing with huge companies super computers etc is not that hard really, how obvious can it be to not short crowded shorts?
It's really easy, ye 95+% fail, they're all just either irrational, braindead, or don't put in the thousands of hours required. Duh! What? You need over 10,000 hours of learning & experience to get anywhere (or at the bare min 5k for a +1 std dev IQ)? NO WAY! Wow this is so hard. You actually have to spend some time actively getting good like with anything else even video games? Impossible!
Every one wants to be a countertrend trader smh. Not just countertrend, ALL TIME HIGH & 25% of all shares sold short countertrend trader. So stupid. There's no excuse. It is stupid.

Quickly Measure Time & Change (Hold Shift + Click the Chart)This chart shows the price of Crude Oil (CL1!) over the last few years. It is a daily chart and we're going to use it as an example to show you how to quickly measure the time and price change of any asset.
Today, major news came out of the Middle East about a conflict that involves the US, Iran, and Iraq. The news had oil spiking higher. However, when you zoom out, you can see a much bigger move has already been in motion since crude oil bottomed in late 2018. Since that day, more than 375 days ago, crude oil is up 48%.
Measuring the distance and change of an asset is easy. Press and hold "Shift" on your keyboard and click on the chart. This measurement tool will show you price change, percentage change, total bars, and time. Follow these steps:
Step 1 - Open a chart for an asset you're interested in.
Step 2 - Hold "Shift" and click on the chart from where you want to measure.
Step 3 - Drag your measurement point to any distance you need.
We hope you enjoyed this chart and quick tip. If you enjoyed it, press Like or leave a comment.

Central bank calendar for 2020Here are the important dates. * The small red lines are supposed to indicate the EUR & USA central bank meeting dates.
Looks like February might be dead, with maybe a bit going on in Oceania.
May calm, maybe some UK & Oceania going on just like the end of 2019, August dead but who cares, and the rest of the year interesting especially June so just like 2019 maybe.
I have some things on the radar for January already.
I am planning my year around this calendar.
Also let's not forget the 2020 election too, this might be the most important date.
For stocks & indices of course but even for those that don't trade those or don't trade them much (like me).
Going to be an interesting year...
In the world of Currencies Gold Metals Energy which is what I do, also what will happen with the climate change hysteria is going to be interesting.
There's a large part of the population that think the world is going to end so what will they do?
They will impact politics and the economy. 10% of israel population are in a sect branch of judaism and the government does some of the thing they want, muslims... well I don't even need to explain that... 10% are salafists which is the world most powerful "cult" or "sect" with a huge impact, and in Eu & Na I guess the number is the same? 10% are deathly afraid of CO2? They will have some impact and this will definitely drive the price of Oil NatGas Copper Nickel which I have in my watchlist, as well as have some impact obviously on the economy.
And will socialism grow? Or fade out? I myself guess it will die out just like in the UK... Seriously, germans voted for Hitler but they were starving. EU & NA populations are not starving so why would they go full insane. East europe went full insane but that was their revolution, they overreacted as usual. France had their revolution in 1789 and it was followed by a period of terror, then Napoleon, then changing governments... Took what like a century to go to a clean democracy? Soviets had socialism with going back and forth between capitalism and full communism from 1920 to 1990, nothing surprising there. I doubt they will go back.
What people call "capitalism" is just the natural order of things. Like it or not everything has a price and a reward. Nothing gets magically created.
Nothing is lost, nothing is created, everything is transformed.
Well, going to be a fun year. I probably won't post much about stock indices, I am just perma long till the Dow gets to ~33k, I won't post much about Bitcoin it is so boring, there is the halving and also now is when satoshi gets his coins? Might be interesting actually.
Just going to focus on USD EUR GBP CAD AUD NZD SEK JPY CHF GOLD NATGAS USOIL COPPER NICKEL.
