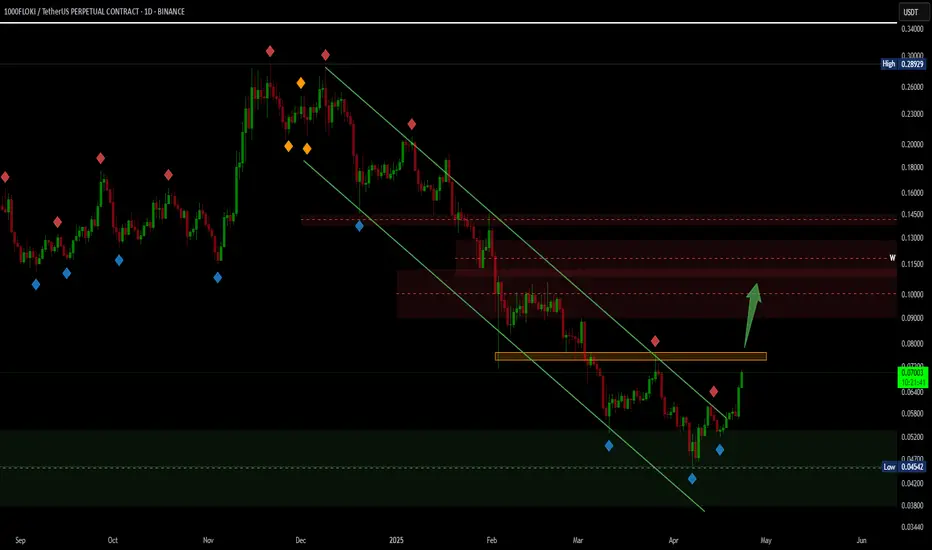
$FLOKI/USDT BREAKOUT TRADE SETUP🚨 $1000floki/USDT Breakout Trade Setup
Massive breakout from a long-term downtrend line on the 1d chart
Price has reclaimed the 0.095–0.10 resistance zone, now acting as support.
- Entry Zone: $0.096 – $0.103
- Targets:
• TP1: $0.14
• TP2: $0.18
• TP3: $0.29 (+192% from breakout zone)
Stop Loss

FLOKI at Key Support – Is a Bounce Coming?The price of FLOKI has dropped back to an important level where it used to face resistance before going up. Now, this same level is acting as support, which could lead to a bounce.
We also see a bullish divergence on the RSI, It often signals that selling is slowing down and a reversal might be co

$FLOKI Breakout alertSEED_DONKEYDAN_MARKET_CAP:FLOKI breakout alert 🚨
Floki has smashed through the major downtrend line, flipping resistance into support.
With volume surging, the Bulls now have an eye for a 260%+ move.
Key upside targets: • $0.10707
• $0.14517
• $0.20593
• $0.28618
Entry: CMP
Trend shift confirmed

FLOKI to the MOON ????Hello all,
Let this grazy coin do some correction and take the rocket take off.
Enjoy
MIZ
1000FLOKI/USDTKey Level Zone: 0.09100 - 0.09280
HMT v6 detected. The setup looks promising, supported by a previous upward/downward trend with increasing volume and momentum, presenting an excellent reward-to-risk opportunity.
HMT (High Momentum Trending):
HMT is based on trend, momentum, volume, and market str

FLOKI/USDT | Retest of Order Block for a Bullish PushThis FLOKI/USDT 4-hour chart suggests a potential bullish continuation after retesting the highlighted demand zone (order block) near $0.18335–$0.17875. The trade plan includes:
Entry within the order block zone to maximize the risk-reward ratio.
Stop-loss set below $0.17875 for protec

1000FLOKI/USDTKey Level Zone : 0.19250 - 0.19550
HMT v4.0 detected. The setup looks promising, supported by a previous upward/downward trend with increasing volume and momentum, presenting an excellent reward-to-risk opportunity.
HMT (High Momentum Trending):
HMT is based on trend, momentum, volume, and market

1000FLOKI/USDT Breaks Out of Bullish FlagFloki USDT has broken out of the bullish flag pattern and retested the breakout level. The price could reach an all-time high (ATH) and potentially surpass it.

FLOKI to all time high!!FLOKI is currently in its larger-degree wave 5 and appears to be losing momentum after finishing wave 1 of the minor degree. A pullback might follow, paving the way for wave 3 of the minor degree to drive FLOKI higher.

Can we get this #FLOKI $FLOKI Trade or not?I think #FLOKI can go higher
Entry: 0.12356
TP: 0.13109
SL: 0.11813
And don't forget to boost if you liked my idea.

See all ideas
Summarizing what the indicators are suggesting.
Oscillators
Neutral
SellBuy
Strong sellStrong buy
Strong sellSellNeutralBuyStrong buy
Oscillators
Neutral
SellBuy
Strong sellStrong buy
Strong sellSellNeutralBuyStrong buy
Summary
Neutral
SellBuy
Strong sellStrong buy
Strong sellSellNeutralBuyStrong buy
Summary
Neutral
SellBuy
Strong sellStrong buy
Strong sellSellNeutralBuyStrong buy
Summary
Neutral
SellBuy
Strong sellStrong buy
Strong sellSellNeutralBuyStrong buy
Moving Averages
Neutral
SellBuy
Strong sellStrong buy
Strong sellSellNeutralBuyStrong buy
Moving Averages
Neutral
SellBuy
Strong sellStrong buy
Strong sellSellNeutralBuyStrong buy
Displays a symbol's price movements over previous years to identify recurring trends.