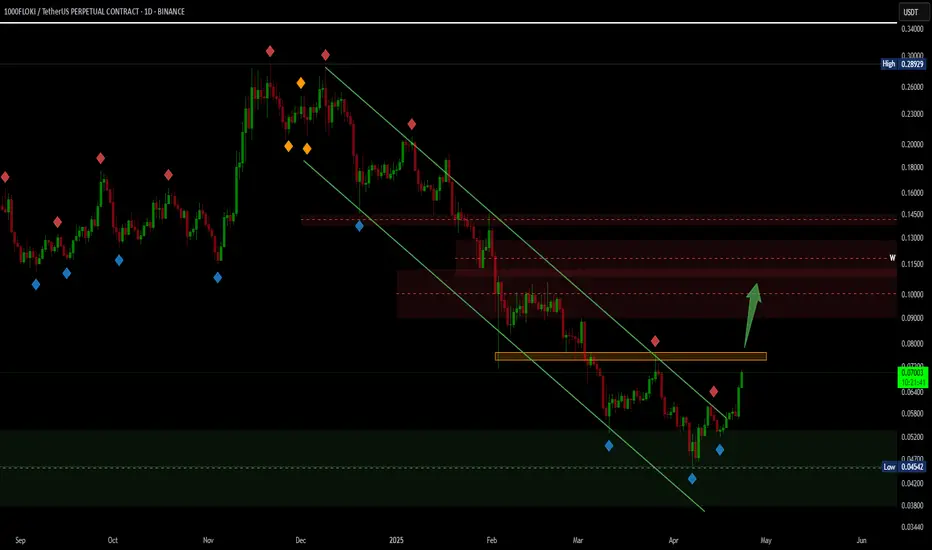
$FLOKI/USDT BREAKOUT TRADE SETUP🚨 $1000floki/USDT Breakout Trade Setup
Massive breakout from a long-term downtrend line on the 1d chart
Price has reclaimed the 0.095–0.10 resistance zone, now acting as support.
- Entry Zone: $0.096 – $0.103
- Targets:
• TP1: $0.14
• TP2: $0.18
• TP3: $0.29 (+192% from breakout zone)
Stop Loss: $0.08686
Leverage Suggestion: 3–5x max
Clean bullish structure.DYOR, NFA
1000FLOKIUSDT.P trade ideas

FLOKI at Key Support – Is a Bounce Coming?The price of FLOKI has dropped back to an important level where it used to face resistance before going up. Now, this same level is acting as support, which could lead to a bounce.
We also see a bullish divergence on the RSI, It often signals that selling is slowing down and a reversal might be coming.
If the price holds above this support zone, we might see a bounce toward the $0.09 to $0.11 area.
If the price breaks below the support, the idea may not work, so it’s important to manage risk.

$FLOKI Breakout alertSEED_DONKEYDAN_MARKET_CAP:FLOKI breakout alert 🚨
Floki has smashed through the major downtrend line, flipping resistance into support.
With volume surging, the Bulls now have an eye for a 260%+ move.
Key upside targets: • $0.10707
• $0.14517
• $0.20593
• $0.28618
Entry: CMP
Trend shift confirmed? DYOR, NFA

FLOKI to the MOON ????Hello all,
Let this grazy coin do some correction and take the rocket take off.
Enjoy
MIZ
1000FLOKI/USDTKey Level Zone: 0.09100 - 0.09280
HMT v6 detected. The setup looks promising, supported by a previous upward/downward trend with increasing volume and momentum, presenting an excellent reward-to-risk opportunity.
HMT (High Momentum Trending):
HMT is based on trend, momentum, volume, and market structure across multiple timeframes. It highlights setups with strong potential for upward movement and higher rewards.
Whenever I spot a signal for my own trading, I’ll share it. Please note that conducting a comprehensive analysis on a single timeframe chart can be quite challenging and sometimes confusing. I appreciate your understanding of the effort involved.
Important Note :
Role of Key Levels:
- These zones are critical for analyzing price trends. If the key level zone holds, the price may continue trending in the expected direction. However, momentum may increase or decrease based on subsequent patterns.
- Breakouts: If the key level zone breaks, it signals a stop-out. For reversal traders, this presents an opportunity to consider switching direction, as the price often retests these zones, which may act as strong support-turned-resistance (or vice versa).
My Trading Rules
Risk Management
- Maximum risk per trade: 2.5%.
- Leverage: 5x.
Exit Strategy
Profit-Taking:
- Sell at least 70% on the 3rd wave up (LTF Wave 5).
- Typically, sell 50% during a high-volume spike.
- Adjust stop-loss to breakeven once the trade achieves a 1.5:1 reward-to-risk ratio.
- If the market shows signs of losing momentum or divergence, ill will exit at breakeven.
The market is highly dynamic and constantly changing. HMT signals and target profit (TP) levels are based on the current price and movement, but market conditions can shift instantly, so it is crucial to remain adaptable and follow the market's movement.
If you find this signal/analysis meaningful, kindly like and share it.
Thank you for your support~
Sharing this with love!
HMT v2.0:
- Major update to the Momentum indicator
- Reduced false signals from inaccurate momentum detection
- New screener with improved accuracy and fewer signals
HMT v3.0:
- Added liquidity factor to enhance trend continuation
- Improved potential for momentum-based plays
- Increased winning probability by reducing entries during peaks
HMT v3.1:
- Enhanced entry confirmation for improved reward-to-risk ratios
HMT v4.0:
- Incorporated buying and selling pressure in lower timeframes to enhance the probability of trending moves while optimizing entry timing and scaling
HMT v4.1:
- Enhanced take-profit (TP) target by incorporating market structure analysis
HMT v5 :
Date: 23/01/2025
- Refined wave analysis for trending conditions
- Incorporated lower timeframe (LTF) momentum to strengthen trend reliability
- Re-aligned and re-balanced entry conditions for improved accuracy
HMT v6 :
Date : 15/02/2025
- Integrated strong accumulation activity into in-depth wave analysis

FLOKI/USDT | Retest of Order Block for a Bullish PushThis FLOKI/USDT 4-hour chart suggests a potential bullish continuation after retesting the highlighted demand zone (order block) near $0.18335–$0.17875. The trade plan includes:
Entry within the order block zone to maximize the risk-reward ratio.
Stop-loss set below $0.17875 for protection against invalidation.
Targeting $0.20618, aligned with a significant resistance level from previous price action.
This setup anticipates a bounce driven by demand from the order block. Use proper risk management and adjust based on evolving market conditions. Feedback is appreciated—let's refine this together!

1000FLOKI/USDTKey Level Zone : 0.19250 - 0.19550
HMT v4.0 detected. The setup looks promising, supported by a previous upward/downward trend with increasing volume and momentum, presenting an excellent reward-to-risk opportunity.
HMT (High Momentum Trending):
HMT is based on trend, momentum, volume, and market structure across multiple timeframes. It highlights setups with strong potential for upward movement and higher rewards.
Whenever I spot a signal for my own trading, I’ll share it. Please note that conducting a comprehensive analysis on a single timeframe chart can be quite challenging and sometimes confusing. I appreciate your understanding of the effort involved.
Important Note :
Role of Key Levels:
- These zones are critical for analyzing price trends. If the key level zone holds, the price may continue trending in the expected direction. However, momentum may increase or decrease based on subsequent patterns.
- Breakouts: If the key level zone breaks, it signals a stop-out. For reversal traders, this presents an opportunity to consider switching direction, as the price often retests these zones, which may act as strong support-turned-resistance (or vice versa).
My Trading Rules
Risk Management
- Maximum risk per trade: 2.5%.
- Leverage: 5x.
Exit Strategy
Profit-Taking:
- Sell at least 70% on the 3rd wave up (LTF Wave 5).
- Typically, sell 50% during a high-volume spike.
- Adjust stop-loss to breakeven once the trade achieves a 1.5:1 reward-to-risk ratio.
- If the market shows signs of losing momentum or divergence, ill will exit at breakeven.
The market is highly dynamic and constantly changing. HMT signals and target profit (TP) levels are based on the current price and movement, but market conditions can shift instantly, so it is crucial to remain adaptable and follow the market's movement.
If you find this signal/analysis meaningful, kindly like and share it.
Thank you for your support~
Sharing this with love!
HMT v2.0:
- Major update to the Momentum indicator
- Reduced false signals from inaccurate momentum detection
- New screener with improved accuracy and fewer signals
HMT v3.0:
- Added liquidity factor to enhance trend continuation
- Improved potential for momentum-based plays
- Increased winning probability by reducing entries during peaks
HMT v3.1:
- Enhanced entry confirmation for improved reward-to-risk ratios
HMT v4.0:
- Incorporated buying and selling pressure in lower timeframes to enhance the probability of trending moves while optimizing entry timing and scaling

1000FLOKI/USDT Breaks Out of Bullish FlagFloki USDT has broken out of the bullish flag pattern and retested the breakout level. The price could reach an all-time high (ATH) and potentially surpass it.

FLOKI to all time high!!FLOKI is currently in its larger-degree wave 5 and appears to be losing momentum after finishing wave 1 of the minor degree. A pullback might follow, paving the way for wave 3 of the minor degree to drive FLOKI higher.

Can we get this #FLOKI $FLOKI Trade or not?I think #FLOKI can go higher
Entry: 0.12356
TP: 0.13109
SL: 0.11813
And don't forget to boost if you liked my idea.

MemecoinFloki looks like he is going to have an upcoming bullish rally.
There is a weekly bullish pattern and on the 4-hour chart it is making a retracement to continue rising.


Bullish on $FLOKI1. We have structure shift in H2 and H1
2. We have treated the H2 OB+ as 'support'
3. We have buyside liquidity to purge at OTE

FLOKI planCurrently:
- At GP
- Bullish divs(1h)
Plan:
- Fills bearish FVG
- Makes lower low but higher low on RSI (bullish div on a higher timeframe(4h)
- Still remains in GP, matches rest of the market timing for week 3 pump in october

Floki Coin looking bullish!Big moves ahead for the #FlokiArmy
Still some resistance here, but very solid
Do you think it rejects or breakout, comment below!

FLOKI shortPatches are in progress for MEM coins. For example, Floki marked the liquidity zone on the graph - where traders' stop orders are located.
It makes sense to wait for a bit of growth to consider bearish positions because the range is too wide to open a position right now.
Also at the same time Bitcoin is down and moving towards 55000. My recommendation is not to enter the market now expecting a rise

FLOKI ROADMAP (1D)From the place where we placed the red arrow on the chart, FLOKI's correction seems to have started.
This correction looks like a diametric that we are now in the D wave.
In the red box, wave D can end and we can enter wave E.
Closing a candle above the invalidation level will violate the analysis
For risk management, please don't forget stop loss and capital management
Comment if you have any questions
Thank You

#FLOKI Double Bottom Bullish Structure📊#FLOKI Double Bottom Bullish Structure📈
🧠 After making a weekly correction, we constructed a double bottom bullish structure near the weekly buy zone. At present, we have reached the stage resistance zone and encountered resistance. If there can be a good callback, I will consider placing some long orders. If you make a horizontal consolidation breakthrough, you can pay attention to the entry opportunities during the breakthrough.
Let’s see 👀
🤜If you like my analysis, please like 💖 and share 💬
💕 Follow me so you don't miss out on any signals and analyze 💯
BINANCE:1000FLOKIUSDT.P

FLOKI. 0.12895. LONGThe token recovers well, there is no reaction to a false breakout, the long zone is clean, there are no deep pullbacks. We are going to retest the nearest strong level. There is good accumulation below the level.

1000FLOKIUSDT: Bullish TrendFOLKI is formed bullish divergence on 1hr time frame, previously FLOKI is moving in down trend and forming LLs and LHs but after the bullish divergence FLOKI change the trend from Bearish to Bullish so we will wait for the break of the previous LHs for the confirmation of the bullish trend and take a long/buy trade.

#1000FLOKI has a chance to form a bullish head and shoulders📊#1000FLOKI has a chance to form a bullish head and shoulders📈
🧠We have expectations of a rebound after sweeping the liquidity pool. From a structural perspective, we have the opportunity to build a bullish head and shoulders structure, which will be established after breaking through the inflection point. If this bullish structure holds, ideal targets could see 0.22400-0.24810.🎯
Let's see👀
🤜If you like my analysis, please like 💖 and share 💬
💕 Follow me so you don't miss out on any signals and analyze 💯
BINANCE:1000FLOKIUSDT.P

FLOKIUSDT | Another Small Correction Downside?🐶📉 Market Context
Are we on the verge of another downside correction for FLOKIUSDT? It certainly looks possible!
Strategy
Friday saw a strong move down, and we usually fill those wicks sooner or later. Given this pattern, we could see FLOKIUSDT dip a few more pips. This setup presents a quick 1.5:1 risk-reward trade—an exciting opportunity to capitalize on the market's momentum!
Let’s dive in and see how it plays out—stay tuned!

Floki up 35%here is an update on floki
CRYPTOCAP:FLOKI is in n the banana zone
up next after CRYPTOCAP:PEPE
Send it 🍌🍌🚀🚀
target on chart
