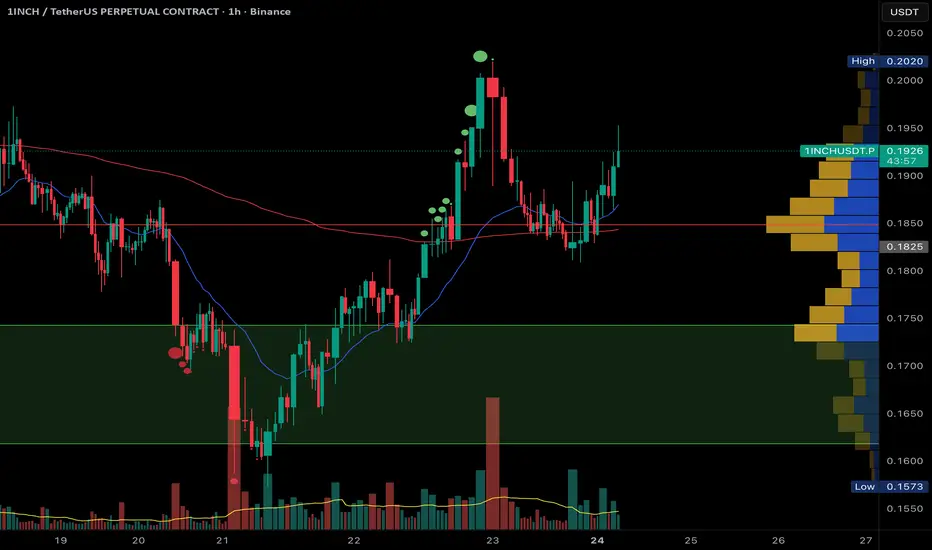
1INCH: Swing position on the daily chart.Excellent structure. I removed the fat — liquidity capture.
The target is 0.204.
When 0.17 is reached, I will secure part of the profit and move the stop to break even.
BYBIT:1INCHUSDT.P

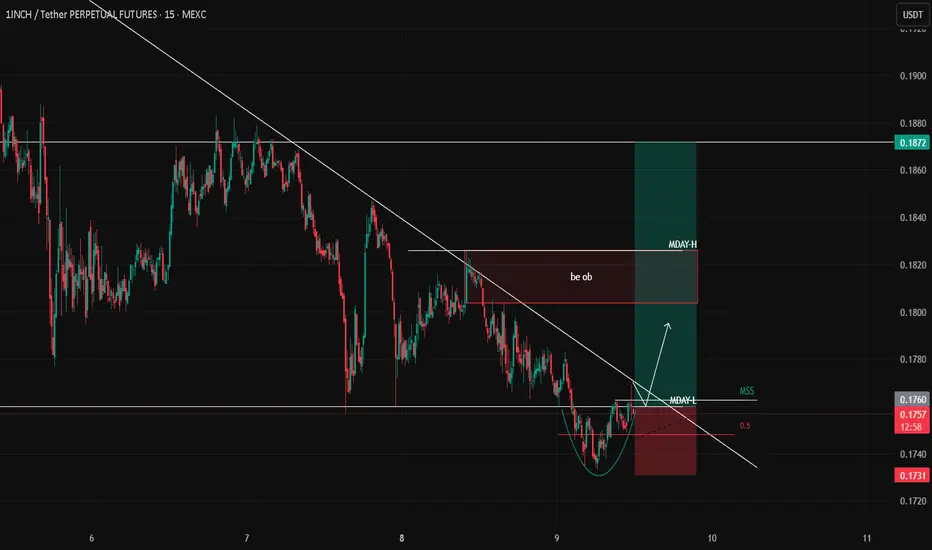
1INCH – Long Setup Idea (15m)The weekend range has been fully swept, and price has moved back inside the Monday range. After reclaiming the MDAY-Low, we can see early signs of a shift in momentum, supported by the Total Market Cap structure which also suggests a potential long opportunity.
Price is breaking above the descendi
$1INCH/USDT ANALYSISOn the 3-day chart of 1INCH/USDT, the price is trading inside a long-term descending triangle pattern, capped by a strong downtrend line from the previous major high near $0.60. The horizontal support zone around $0.16–$0.18 has repeatedly held since early 2025, acting as a major accumulation base.

#1INCHUSDT — Accumulation or the Beginning of a Breakdown?#1INCH
The price is moving within an ascending channel on the 1-hour timeframe and is adhering to it well. It is poised to break out strongly and retest the channel.
We have a downtrend line on the RSI indicator that is about to break and retest, which supports the upward move.
There is a key sup

Exciting path ahead for 1Inch BUY RATINGThis looks extremely attractive on Valuation and the upside potential after Ethereum Upgrade. We can expect a minimum 20-40% in short term!
1INCHUSDT 1D#1INCH is moving inside a descending channel on the daily chart. It is currently trading above the channel’s midline, but there’s a chance it may pull back to retest that midline. Consider buying a small bag here and near the support level at $0.1718, as well as the support zone at $0.1532 ~ $0.1456

1INCH Analysis (2H)The internal trendline has been broken and the structure is bearish. Below the current price, there is an important support level that has been tested multiple times, and lower highs have formed, indicating selling pressure.
The targets are marked on the chart.
A daily candle closing above the inv

$1INCH Update📊 $1INCH Update
$1INCH has formed a Double Top pattern 🧠
If price breaks below the 🔵 support zone, it could confirm a bearish setup 📉
Short-term target = 🟢 level 👇


1INCH USDT LONG SIGNAL---
📢 Signal Alert
🔹 Pair: 1INCH / USDT
📈 Trade Type: Long
💰 Entry Zone: 0.1580
🎯 Take-Profit Targets:
TP1 = 0.1600
TP2 = 0.1630
TP3 = 0.1660
🛑 Stop-Loss: 0.1555
📊 Timeframe: 1H
⚖️ Risk/Reward Ratio: 2.57
📌 Suggested Leverage: 5x–10x
🔄 After TP1 is reached, move Stop-Loss to Entry to secur

See all ideas
Summarizing what the indicators are suggesting.
Oscillators
Neutral
SellBuy
Strong sellStrong buy
Strong sellSellNeutralBuyStrong buy
Oscillators
Neutral
SellBuy
Strong sellStrong buy
Strong sellSellNeutralBuyStrong buy
Summary
Neutral
SellBuy
Strong sellStrong buy
Strong sellSellNeutralBuyStrong buy
Summary
Neutral
SellBuy
Strong sellStrong buy
Strong sellSellNeutralBuyStrong buy
Summary
Neutral
SellBuy
Strong sellStrong buy
Strong sellSellNeutralBuyStrong buy
Moving Averages
Neutral
SellBuy
Strong sellStrong buy
Strong sellSellNeutralBuyStrong buy
Moving Averages
Neutral
SellBuy
Strong sellStrong buy
Strong sellSellNeutralBuyStrong buy
Displays a symbol's price movements over previous years to identify recurring trends.