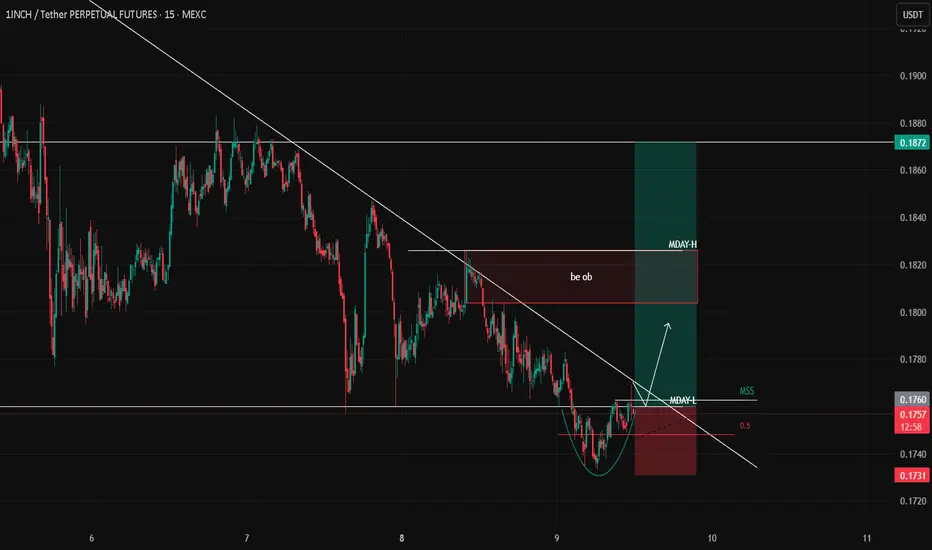
1INCH – Long Setup Idea (15m)The weekend range has been fully swept, and price has moved back inside the Monday range. After reclaiming the MDAY-Low, we can see early signs of a shift in momentum, supported by the Total Market Cap structure which also suggests a potential long opportunity.
Price is breaking above the descendi
Related pairs
$1INCH/USDT ANALYSISOn the 3-day chart of 1INCH/USDT, the price is trading inside a long-term descending triangle pattern, capped by a strong downtrend line from the previous major high near $0.60. The horizontal support zone around $0.16–$0.18 has repeatedly held since early 2025, acting as a major accumulation base.

#1INCHUSDT — Accumulation or the Beginning of a Breakdown?#1INCH
The price is moving within an ascending channel on the 1-hour timeframe and is adhering to it well. It is poised to break out strongly and retest the channel.
We have a downtrend line on the RSI indicator that is about to break and retest, which supports the upward move.
There is a key sup

Exciting path ahead for 1Inch BUY RATINGThis looks extremely attractive on Valuation and the upside potential after Ethereum Upgrade. We can expect a minimum 20-40% in short term!
1INCHUSDT 1D#1INCH is moving inside a descending channel on the daily chart. It is currently trading above the channel’s midline, but there’s a chance it may pull back to retest that midline. Consider buying a small bag here and near the support level at $0.1718, as well as the support zone at $0.1532 ~ $0.1456

1INCH Analysis (2H)The internal trendline has been broken and the structure is bearish. Below the current price, there is an important support level that has been tested multiple times, and lower highs have formed, indicating selling pressure.
The targets are marked on the chart.
A daily candle closing above the inv

$1INCH Update📊 $1INCH Update
$1INCH has formed a Double Top pattern 🧠
If price breaks below the 🔵 support zone, it could confirm a bearish setup 📉
Short-term target = 🟢 level 👇


1INCH USDT LONG SIGNAL---
📢 Signal Alert
🔹 Pair: 1INCH / USDT
📈 Trade Type: Long
💰 Entry Zone: 0.1580
🎯 Take-Profit Targets:
TP1 = 0.1600
TP2 = 0.1630
TP3 = 0.1660
🛑 Stop-Loss: 0.1555
📊 Timeframe: 1H
⚖️ Risk/Reward Ratio: 2.57
📌 Suggested Leverage: 5x–10x
🔄 After TP1 is reached, move Stop-Loss to Entry to secur

1INCH/USDT — Accumulation or the Beginning of a Breakdown?The price of 1INCH is currently trading within a major historical support zone between 0.175 – 0.155 USDT, a level that has repeatedly acted as a key turning point since mid-2024.
Recently, the market revisited this critical zone under strong selling pressure but showed a sharp liquidity wick down t

See all ideas
Summarizing what the indicators are suggesting.
Oscillators
Neutral
SellBuy
Strong sellStrong buy
Strong sellSellNeutralBuyStrong buy
Oscillators
Neutral
SellBuy
Strong sellStrong buy
Strong sellSellNeutralBuyStrong buy
Summary
Neutral
SellBuy
Strong sellStrong buy
Strong sellSellNeutralBuyStrong buy
Summary
Neutral
SellBuy
Strong sellStrong buy
Strong sellSellNeutralBuyStrong buy
Summary
Neutral
SellBuy
Strong sellStrong buy
Strong sellSellNeutralBuyStrong buy
Moving Averages
Neutral
SellBuy
Strong sellStrong buy
Strong sellSellNeutralBuyStrong buy
Moving Averages
Neutral
SellBuy
Strong sellStrong buy
Strong sellSellNeutralBuyStrong buy
Displays a symbol's price movements over previous years to identify recurring trends.
Frequently Asked Questions
The current price of 1inch/Tether USD (1INCH) is 0.1760 USDT — it has fallen −2.30% in the past 24 hours. Try placing this info into the context by checking out what coins are also gaining and losing at the moment and seeing 1INCH price chart.
1inch/Tether USD price has fallen by −9.81% over the last week, its month performance shows a −16.63% decrease, and as for the last year, 1inch/Tether USD has decreased by −65.88%. See more dynamics on 1INCH price chart.
Keep track of coins' changes with our Crypto Coins Heatmap.
Keep track of coins' changes with our Crypto Coins Heatmap.
1inch/Tether USD (1INCH) reached its highest price on Oct 27, 2021 — it amounted to 16.2486 USDT. Find more insights on the 1INCH price chart.
See the list of crypto gainers and choose what best fits your strategy.
See the list of crypto gainers and choose what best fits your strategy.
1inch/Tether USD (1INCH) reached the lowest price of 0.1037 USDT on Oct 10, 2025. View more 1inch/Tether USD dynamics on the price chart.
See the list of crypto losers to find unexpected opportunities.
See the list of crypto losers to find unexpected opportunities.
The safest choice when buying 1INCH is to go to a well-known crypto exchange. Some of the popular names are Binance, Coinbase, Kraken. But you'll have to find a reliable broker and create an account first. You can trade 1INCH right from TradingView charts — just choose a broker and connect to your account.
Crypto markets are famous for their volatility, so one should study all the available stats before adding crypto assets to their portfolio. Very often it's technical analysis that comes in handy. We prepared technical ratings for 1inch/Tether USD (1INCH): today its technical analysis shows the sell signal, and according to the 1 week rating 1INCH shows the strong sell signal. And you'd better dig deeper and study 1 month rating too — it's sell. Find inspiration in 1inch/Tether USD trading ideas and keep track of what's moving crypto markets with our crypto news feed.
1inch/Tether USD (1INCH) is just as reliable as any other crypto asset — this corner of the world market is highly volatile. Today, for instance, 1inch/Tether USD is estimated as 4.28% volatile. The only thing it means is that you must prepare and examine all available information before making a decision. And if you're not sure about 1inch/Tether USD, you can find more inspiration in our curated watchlists.
You can discuss 1inch/Tether USD (1INCH) with other users in our public chats, Minds or in the comments to Ideas.