1INCH: Swing position on the daily chart.Excellent structure. I removed the fat — liquidity capture.
The target is 0.204.
When 0.17 is reached, I will secure part of the profit and move the stop to break even.
BYBIT:1INCHUSDT.P
Market insights

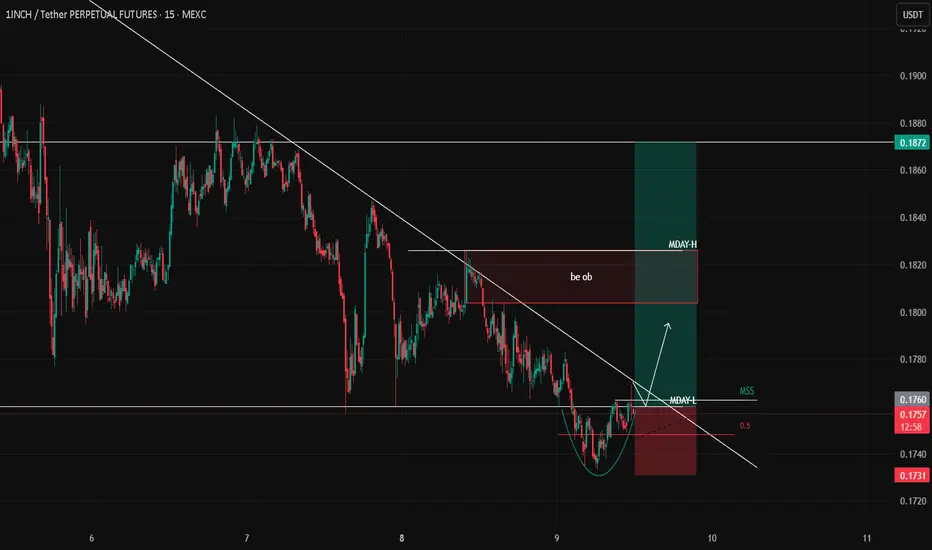
1INCH – Long Setup Idea (15m)The weekend range has been fully swept, and price has moved back inside the Monday range. After reclaiming the MDAY-Low, we can see early signs of a shift in momentum, supported by the Total Market Cap structure which also suggests a potential long opportunity.
Price is breaking above the descending trendline while forming a rounded retest structure. My first target is the Monday High (MDAY-H), where a bearish order block sits. I plan to secure 50% profits at that level and let the remainder run if market strength continues.
Invalidation sits below the recent swing low.
MrC
$1INCH/USDT ANALYSISOn the 3-day chart of 1INCH/USDT, the price is trading inside a long-term descending triangle pattern, capped by a strong downtrend line from the previous major high near $0.60. The horizontal support zone around $0.16–$0.18 has repeatedly held since early 2025, acting as a major accumulation base. Each dip into this area has been met with buying pressure, shown by long lower wicks and volume spikes, confirming it as a strong demand zone. However, momentum remains weak as the candles are still forming below the Ichimoku cloud, keeping the broader trend bearish.
Currently, 1INCH is consolidating near $0.19, facing resistance from the descending trendline and lower edge of the cloud near $0.22–$0.24. A decisive breakout and close above that zone would be the first sign of a potential trend reversal, possibly targeting $0.28–$0.32 in the mid-term. But if the price fails to hold above the $0.16–$0.18 support and breaks down, it could extend lower toward $0.13–$0.14, which is the next major liquidity pocket. Overall, the structure remains bearish-neutral, with accumulation signs at the base but no confirmed reversal until a breakout above the descending trendline.

#1INCHUSDT — Accumulation or the Beginning of a Breakdown?#1INCH
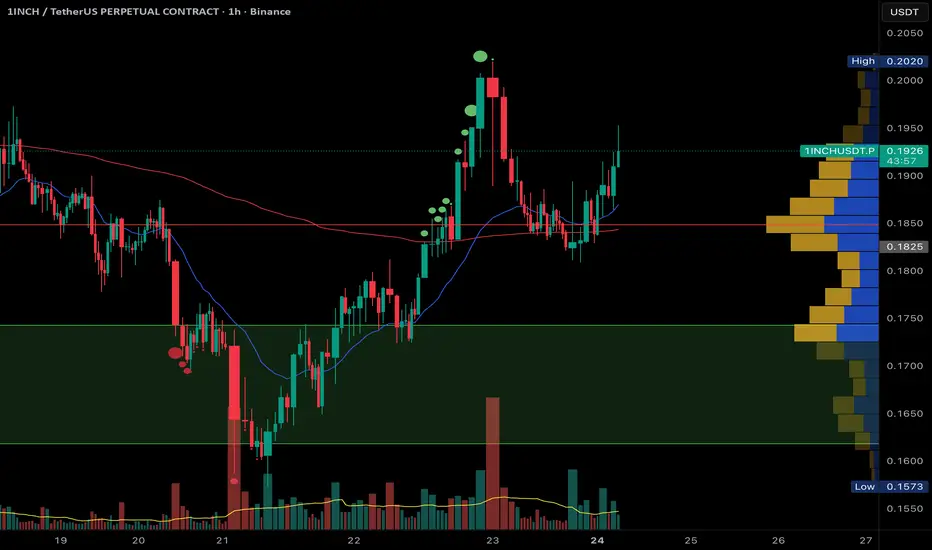
The price is moving within an ascending channel on the 1-hour timeframe and is adhering to it well. It is poised to break out strongly and retest the channel.
We have a downtrend line on the RSI indicator that is about to break and retest, which supports the upward move.
There is a key support zone in green at 0.1770, representing a strong support point.
We have a trend of consolidation above the 100-period moving average.
Entry price: 0.1909
First target: 0.1954
Second target: 0.2010
Third target: 0.2080
Don't forget a simple money management rule:
Place your stop-loss order below the green support zone.
Once you reach the first target, save some money and then change your stop-loss order to an entry order.
For any questions, please leave a comment.
Thank you.

Exciting path ahead for 1Inch BUY RATINGThis looks extremely attractive on Valuation and the upside potential after Ethereum Upgrade. We can expect a minimum 20-40% in short term!
1INCHUSDT 1D#1INCH is moving inside a descending channel on the daily chart. It is currently trading above the channel’s midline, but there’s a chance it may pull back to retest that midline. Consider buying a small bag here and near the support level at $0.1718, as well as the support zone at $0.1532 ~ $0.1456 in case of a deeper dip, which could happen depending on Bitcoin’s movement tomorrow.
If price breaks above both the channel resistance and the daily SMA100, the potential upside targets are:
🎯 $0.2381
🎯 $0.2694
🎯 $0.3008
🎯 $0.3453
🎯 $0.4021
⚠️ Always use a tight stop-loss and maintain proper risk management.

1INCH Analysis (2H)The internal trendline has been broken and the structure is bearish. Below the current price, there is an important support level that has been tested multiple times, and lower highs have formed, indicating selling pressure.
The targets are marked on the chart.
A daily candle closing above the invalidation level will invalidate this analysis.
Do not enter the position without capital management and stop setting
Comment if you have any questions
thank you

$1INCH Update📊 $1INCH Update
$1INCH has formed a Double Top pattern 🧠
If price breaks below the 🔵 support zone, it could confirm a bearish setup 📉
Short-term target = 🟢 level 👇


1INCH USDT LONG SIGNAL---
📢 Signal Alert
🔹 Pair: 1INCH / USDT
📈 Trade Type: Long
💰 Entry Zone: 0.1580
🎯 Take-Profit Targets:
TP1 = 0.1600
TP2 = 0.1630
TP3 = 0.1660
🛑 Stop-Loss: 0.1555
📊 Timeframe: 1H
⚖️ Risk/Reward Ratio: 2.57
📌 Suggested Leverage: 5x–10x
🔄 After TP1 is reached, move Stop-Loss to Entry to secure profits.
---
🧠 Technical Analysis Explanation
1INCH is showing early bullish momentum after holding above the 0.1550–0.1560 support zone, which has been acting as a strong accumulation area.
The market structure on the 1H chart remains bullish, with higher lows forming and the price maintaining above the EMA 50, signaling continued buying strength.
The RSI has crossed above the 50 midline, indicating a shift in momentum toward buyers. The entry at 0.1580 aligns with the retest of a minor resistance turned support, offering a favorable risk/reward setup.
Targets are set near short-term resistance levels visible in the previous price action. The stop-loss at 0.1555 sits below the latest higher low, providing safety against a potential fakeout.
⚙️ Trade Management Tip: Wait for a 1H bullish candle close confirmation before entry. Move stop-loss to entry after TP1 and manage partial profits at each target for optimal capital protection.
-

1INCH/USDT — Accumulation or the Beginning of a Breakdown?The price of 1INCH is currently trading within a major historical support zone between 0.175 – 0.155 USDT, a level that has repeatedly acted as a key turning point since mid-2024.
Recently, the market revisited this critical zone under strong selling pressure but showed a sharp liquidity wick down to 0.1036 USDT, followed by an immediate recovery — a classic signal of liquidity absorption or a potential accumulation event by larger players.
In other words, this zone represents the final line of defense for buyers — holding above it could trigger a major rebound, while a confirmed breakdown below may lead to deeper capitulation.
---
Structure and Pattern Overview
Overall trend: still bearish, forming a sequence of lower highs and lower lows.
Yellow zone (0.175 – 0.155): a strong demand area that has acted as a reliable support multiple times.
Long wick to 0.1036: a sign of extreme liquidation followed by potential smart money accumulation.
Potential formation: if the price holds this zone and forms a higher low, a double bottom pattern could emerge — a classic early reversal signal.
---
Bullish Scenario
If 1INCH holds above 0.175 – 0.155 and forms a strong bullish 3D candle with rising volume, a potential reversal could begin.
Main confirmation: 3D candle close above 0.19 USDT.
Bullish targets:
0.2346 → first resistance to reclaim.
0.2730 → breakout confirmation level.
0.3515 → primary swing target if structure shifts bullish.
Narrative: this area could serve as a major accumulation base before the next markup phase, signaling that institutional buyers are quietly positioning before a broader trend reversal.
---
Bearish Scenario
If 1INCH closes below 0.155 USDT with strong momentum, the support zone will fail, and sellers will regain full control.
First downside target: 0.1036 (previous wick low).
Below 0.1036: the next psychological area lies around 0.09 – 0.08 USDT.
Narrative: a breakdown here would indicate full bearish dominance and could trigger a capitulation phase before any potential recovery.
---
Market Psychology
The 0.175 – 0.155 USDT zone represents a psychological battleground between fear and opportunity.
Retail traders who panic-sold below 0.16 may have provided the liquidity needed for smart money to accumulate positions.
If volume confirms steady buying interest within this area, we could soon witness the beginning of the next bullish markup phase for 1INCH.
---
Conclusion
1INCH is now standing at one of its most critical levels of 2025.
This is more than just a technical support — it’s the decisive zone for the medium-term trend.
Holding above 0.155 = possible start of a major reversal.
Breaking below 0.155 = potential continuation to 0.1036 or lower.
From this point, the market will decide whether 1INCH enters a strong accumulation phase or dives into its final capitulation stage.
---
#1INCH #CryptoAnalysis #1INCHUSDT #CryptoTrading #AltcoinWatch #ReversalZone #SupportZone #BearishVsBullish #PriceAction #MarketStructure #SwingTrade #LiquiditySweep

1INCH Analysis (12H)From the point marked START on the chart, a corrective phase seems to have formed on the 1INCH pair.
This phase appears to be a diametric, and we are currently in wave F of this diametric.
Within the red zone, wave F could terminate, after which wave G is expected to begin. Wave G is a bearish wave.
Targets are shown on the chart.
A daily candle close above the invalidation level will negate this analysis.
For risk management, please don't forget stop loss and capital management
When we reach the first target, save some profit and then change the stop to entry
Comment if you have any questions
Thank You


1INCH/USDT (3D) — at Demand Zone: Accumulation or Breakdown?Analysis:
The 3-day chart shows 1INCH consolidating tightly within the 0.23–0.25 demand zone, an area that has acted as a critical base since mid-2024.
Every touch of this zone has triggered a strong bullish reaction, proving it’s a key defense area for buyers. However, repeated retests also weaken its strength — making this retest a make-or-break moment for the mid-term trend.
Price is currently moving sideways with declining volatility, suggesting the market is in a final consolidation phase before a major directional move.
This zone will decide whether we see a strong reversal rally or a structural breakdown into new lows.
---
Key Technical Structure
Demand Zone (Major Support): 0.23 – 0.25
Nearest Resistance: 0.27 – 0.30
Higher Resistances: 0.354 → 0.436 → 0.533 → 0.659
Major Support Below: 0.148
---
Price Structure & Pattern
1INCH has been forming a broad horizontal range with multiple retests at 0.23–0.25, signaling potential base accumulation.
However, the macro structure still shows a series of lower highs, keeping the overall trend bearish-to-neutral until a confirmed breakout occurs.
Long downside wicks around 0.23 indicate liquidity sweeps — a common sign of institutional accumulation before a major move.
---
Bullish Scenario
Confirmation:
A strong 3D candle close above 0.30 — confirming breakout from the range.
Implication:
Marks the end of accumulation and the beginning of a potential mid-term reversal structure.
Upside Targets:
TP1 → 0.354 (mid-range top)
TP2 → 0.436 (major supply)
TP3 → 0.533 (trend reversal confirmation)
TP4 → 0.659–0.703 (extended target)
Entry Strategy:
Conservative: wait for a 3D close above 0.30 and enter on retest.
Aggressive: enter near 0.23–0.25 upon bullish rejection, with a tight stop below 0.23.
Stop Loss: below 0.23 (breakdown invalidates setup).
---
Bearish Scenario
Confirmation:
A 3D close below 0.23 confirms structural breakdown from the base range.
Implication:
Signals a shift from accumulation to redistribution, resuming the broader downtrend.
Downside Targets:
0.20 → 0.18 (intermediate)
0.15 (major psychological and technical support)
Strategy:
Look for bearish rejection around 0.27–0.30 for short setups, or enter breakdown continuation trades below 0.23 with confirmation.
---
Conclusion
The 0.23–0.25 zone stands as the final equilibrium point between buyers and sellers — the golden demand zone that will dictate 1INCH’s next major trend.
A confirmed breakout above 0.30 could trigger a strong reversal toward 0.53–0.70, while a breakdown below 0.23 opens the door for a drop toward 0.15.
The market is silent — and this calmness often precedes a massive move.
---
#1INCH #CryptoAnalysis #TechnicalAnalysis #Altcoin #Breakout #PriceAction #CryptoTrading #SwingTrade #SupportResistance #MarketStructure #ReversalZone #CryptoMarket #ChartAnalysis
Buy 1INCH📊 1INCH Market Update
Range Context: Since November 2022, 1INCH has been trading within a well-defined range.
Deviation & Reclaim: Price made a deviation below the range, tapped the range low, and is now bouncing back up — a strong signal of buyer defense at key support.
This setup often precedes mean reversion toward mid-range or range high if momentum sustains.
🔥 Catalysts to Watch for 1INCH
Protocol Expansion: New integrations with L2s (Arbitrum, zkSync, Base) could drive fresh volumes to the aggregator.
1inch Fusion Upgrade: Enhancements in swap efficiency and gas optimization continue to attract active DeFi traders.
Liquidity Growth: If trading volume across DEXes picks up (especially with ETH gas spikes), aggregators like 1INCH directly benefit.
Ecosystem Incentives: Potential DAO incentives, partnerships, or new liquidity mining campaigns could draw users back.
Macro Catalyst: Renewed interest in DeFi blue chips as BTC consolidates — rotation flows often favor established protocols like 1INCH.
Disclaimer:
This analysis is based on my personnal views and is not a financial advice. Risk is under your control.

1INCHUSDT 1D#1INCH is moving inside a falling wedge pattern on the daily chart and has bounced off the wedge support line and the daily SMA200. In case of a breakout above the wedge resistance, the potential targets are:
🎯 $0.2780
🎯 $0.3109
🎯 $0.3375
🎯 $0.3640
🎯 $0.4019
🎯 $0.4501
⚠️ Always remember to use a tight stop-loss and follow proper risk management.

1INCH Long Idea1INCH appears to have bottomed out. Informal "M" - Shape with a Type II return. Now, more recently, it appears there has been a trend reversal as well with consecutive higher highs higher lows since the bottom was put in at the PCZ of the informal "M" - shape. And now price appears to be backtesting a spring successfully --> ~.26 cents and is also breaking a downsloping supply line. Good upside if this is real. Kangs.

1INCH/USDT — Critical Accumulation Zone?🔎 Overview
Currently, 1INCH/USDT is trading around $0.2449, sitting right above the key demand zone at $0.21–$0.25 (yellow box). This level has repeatedly acted as a major support, preventing further downside.
On the 3D timeframe, price action shows extended corrective structure after a strong downtrend. This zone is now a make-or-break area: will it turn into an accumulation base for a new bullish cycle, or become a distribution zone before further decline?
---
📌 Market Structure & Price Action
Mid-term trend: still forming lower highs → bias remains neutral-to-bearish until reversal signs appear.
Yellow zone ($0.21–$0.25): major demand zone, repeatedly tested with strong rebounds.
Deep wick spikes → liquidity grabs / stop-hunts before price recovery.
Currently consolidating sideways above demand → market waiting for the next decisive move.
---
🟢 Bullish Scenario
For bullish confirmation, price needs:
1. Hold above $0.21–$0.25 zone.
2. Break & close 3D above $0.30 → early reversal confirmation.
3. Establish higher highs & higher lows → sign of trend shift.
📈 Upside targets:
R1: $0.300
R2: $0.354
R3: $0.436
R4: $0.532
R5: $0.659 – $0.703
With strong momentum, the $0.65–$0.70 zone could act as a mid-term price magnet.
---
🔴 Bearish Scenario
For bearish continuation, price needs:
1. 3D close below $0.21 with volume.
2. Failed retest (previous support flips into resistance).
📉 Downside targets:
S1: $0.190
S2: $0.165
S3: $0.148 (major low on chart)
Breaking below $0.148 would heavily weaken long-term structure for buyers.
---
🎯 Trading Approach & Risk Management
Swing setup: Long from $0.22–$0.24 with stop below $0.195 → target $0.30+.
Breakout setup: Wait for 3D close > $0.305, enter on retest → target $0.354+.
Short setup: Only valid if 3D close < $0.205 with failed retest → targets $0.165–$0.148.
⚠️ Risk note: Keep per-trade risk under 1–3% of capital. Always use stop losses.
---
📊 Key Levels
Main demand/support: $0.21–$0.25
Major resistances: $0.30 → $0.35 → $0.43 → $0.53 → $0.65–0.70
Critical low: $0.148
---
✨ Conclusion
1INCH/USDT is at a decisive crossroads.
Holding the $0.21–$0.25 zone could trigger a bounce toward $0.30 and potentially higher. However, a confirmed breakdown below $0.21 exposes the market to deeper correction toward $0.19–$0.148.
Traders should carefully watch the 3D candle close and volume confirmation before committing to directional trades.
---
#1INCH #1INCHUSDT #CryptoAnalysis #Altcoin #TechnicalAnalysis #CryptoTrading #PriceAction #SwingTrading #BreakoutSetup

1INCH - LONG SET-UP BINANCE:1INCHUSDT
1INCH Long Set-up 📈
Looking good to long between 0.2130 - 0.2241 🔼
SL Below 0.20 or as per your risk capacity 🔽

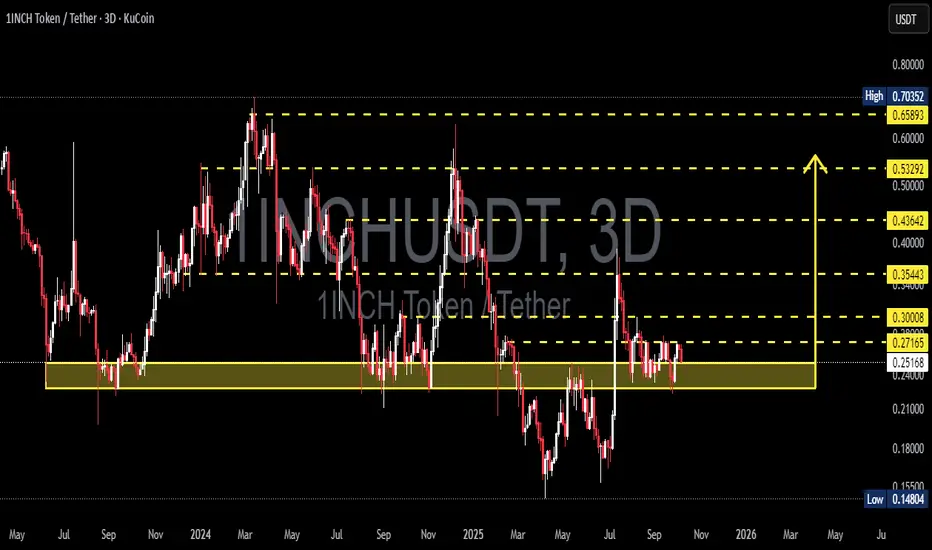
1INCH/USDT — Golden Pocket Re-Test at a Critical Zone!Currently, 1INCH/USDT is trading around $0.2568, sitting right at the Golden Pocket (Fibonacci 0.5–0.618) between $0.242–$0.263. This area is highly significant because:
It has acted as a historical demand zone since 2023, often serving as both support and resistance.
It will determine whether buyers can defend this level for a recovery, or if a breakdown towards lower support levels will occur.
---
🔎 Market Structure & Pattern
Macro trend: Since topping near $0.70, the market has been printing lower highs & lower lows → bearish bias still present.
Golden Pocket zone: Represents a potential accumulation area, where smart money often positions for a reversal.
Recent price action: A sharp retracement occurred after rejection at higher levels, and price is now testing this crucial zone again.
---
🚀 Bullish Scenario
If 1INCH manages to hold above $0.242 and closes the 3D candle strong:
1. This will confirm a successful retest at the golden pocket → strong signal for a rebound.
2. Further confirmation if price breaks & closes above $0.300 with volume.
🎯 Upside Targets:
TP1: $0.300 (+16.9%)
TP2: $0.354 (+38%)
TP3: $0.436 (+70%)
Extended targets if momentum continues: $0.532 – $0.658
📌 Bullish Invalidation: 3D close below $0.242 → bullish thesis fails.
---
🐻 Bearish Scenario
If the golden pocket fails to hold and price closes below $0.242:
1. Support flips to resistance → opening the path for deeper downside.
2. Price may revisit $0.19, with extended risk toward the swing low at $0.148.
🎯 Downside Targets:
TP1: $0.190 (–26%)
TP2: $0.148 (–42%)
📌 Bearish Invalidation: A strong reclaim and close above $0.300 would cancel the bearish outlook.
---
📌 Conclusion & Strategy
$0.242–$0.263 = Decision Zone.
Bullish case: A rebound from this zone could fuel a swing rally toward $0.354 – $0.436.
Bearish case: A breakdown below $0.242 targets $0.19 – $0.148.
Watch for 3D candle close & volume confirmation → critical for the next major move.
👉 Aggressive traders may position within the golden pocket with tight risk management, while conservative traders should wait for 3D confirmation before committing.
#1INCH #1INCHUSDT #CryptoAnalysis #Altcoins #SwingTrade #Fibonacci #SupportResistance #DeFi

1inchSaw that band was pumping with link..
Band being an alternative ethethereum oracle, got me thinking 🤔 there could be an ecosystem wide ethereum network speculative move if eth breaks into aths, uni aave link and crv being some of the bluechip ecosystem coins, they all have derivatives 1inch is a dex aggregator, finding the cheapest route amongst dexs for swaps.
With a speculative wave comes congestion, price premiums etc so tradfi might be getting educated on aggregators quite quickly if they hear there's better swap rates during the speculative wave. 1inch's time to shine. Technically speaking we've been in a long accumulation zone after a mass market alt drawdown from 2022.
A retest of the MA50 1M would be about a 3x from here given how low these alternative coins ended up ~98% from aths.

1INCHUSDT — Elliott Wave View📉 1INCHUSDT — Elliott Wave View
Wave (5) top is in, ABC correction in play.
Wave A done, Wave B topped near 0.2993.
Wave C targets: 0.2016 (0.618 Fib) and 0.1412 (1.0 Fib).
Current price: 0.2679 — further downside expected.
Not financial advice.
#1inch #1inchusdt #elliottwave #cryptoanalysis #cryptotrading #technicalanalysis #priceaction #altcoins #cryptomarket #tradingview

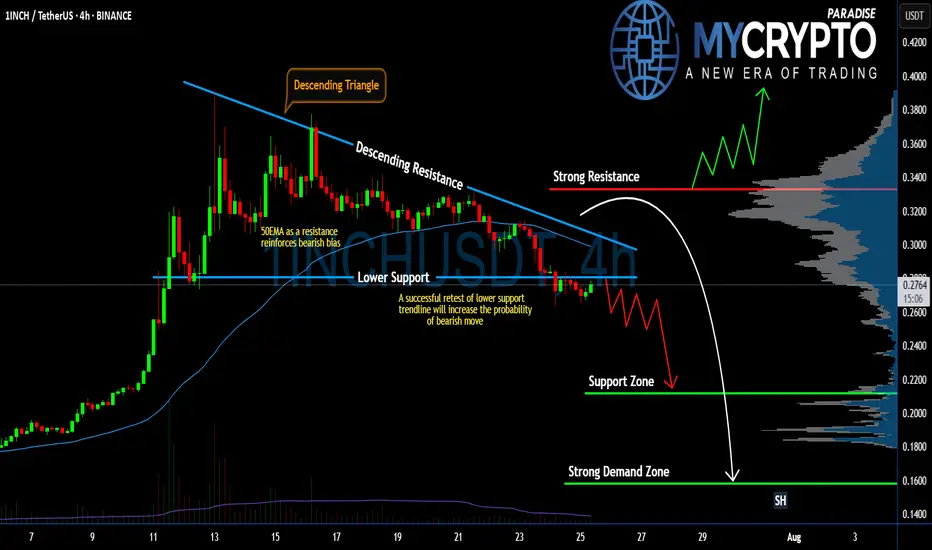
#1INCH Setup Favors Bears | Can Bears Pull it Down Further? Yello Paradisers! Are you prepared for what might be the next big move on #1INCHUSDT? The #1INCHNetwork is flashing clear warning signs:
💎#1INCH is currently trading inside a Descending Triangle, a pattern that historically favors bears. The price has broken down the lower support and is coming to retest it. If #INCHUSD retests the lower support and doesn't enter the descending triangle, the probability of the bearish pressure will increase.
💎The 50 EMA is acting as a strong dynamic resistance, reinforcing the bearish bias. Every attempt to reclaim higher levels has been rejected, and as long as we remain capped below the descending resistance, bulls are at a clear disadvantage.
💎A successful retest of the lower support trendline will significantly increase the probability of a breakdown. If this triangle finally breaks to the downside, we should be watching the $0.2116 support zone as the first key level to catch any temporary reaction.
💎But the real danger — and opportunity for patient traders — lies lower. If $0.2116 fails, the next strong demand zone sits at $0.1582, which could be the level where real buyers finally step back in. Until then, any bullish scenario remains invalid unless the price breaks and closes above the strong resistance at $0.3332.
Trade smart, Paradisers. This setup will reward only the disciplined.
MyCryptoParadise
iFeel the success🌴