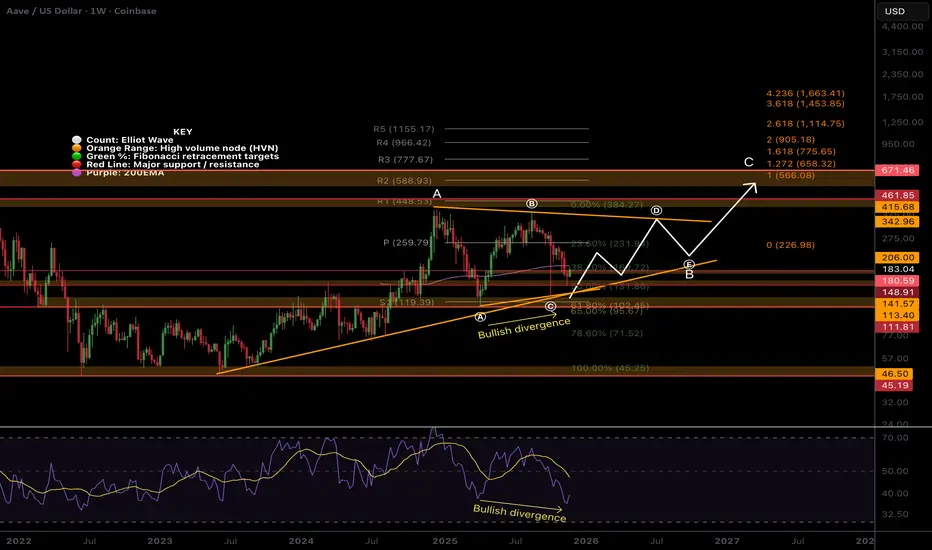
AAVE Macro outlook, weekly bullish divergenceA price range between $440 and $130 continues. Price appears to have completed triangle wave (c) of a larger wave B. Wave (D) is next, with a target of the upper boundary trend-line ~$340.
Price has lost the 200EMA but followed the outlined path of a pump and pullback after wave ©. The weekly pivot is the likely termination point for wave (E), but there is work to be done first. Price found terminal support at the golden pocket Fibonacci retracement.
We are just in a huge range, and there isn’t much more to say on the macro. This asset has been one of the best winners for trading the last 3 years, sticking to the rules strictly.
🎯 Terminal target for the business cycle is still the 1:1 Fib extension, but may be overextended to the 1.272, per wave C rules. Both are around the all-time High Volume Node ~$600
📈 Weekly RSI has room to fall and has printed bullish divergence.
👉 Analysis is invalidated below wave (A) or wave (B)
Safe trading
Trade ideas
AAVE Local, bottoming soon?Locally, price continues bearish after falling out of the wedge, completing wave (B) of the macro triangle. Price action looks ready to reverse
Wave © appears complete after the big drop, black swan event- Oct 10th. I was looking for a dip back into the long lower wick, which we have and price is finding support. This suggests we grind higher from here, but we must get through the daily 200EMA, just above the High Volume Node resistance and daily pivot. This area will be tough to crack and was rejected on the first attempt.
📈 Daily RSI has printed bullish divergence from the oversold threshold- a bottoming signal.
👉 Continued downside has a next target of $114.
Safe trading

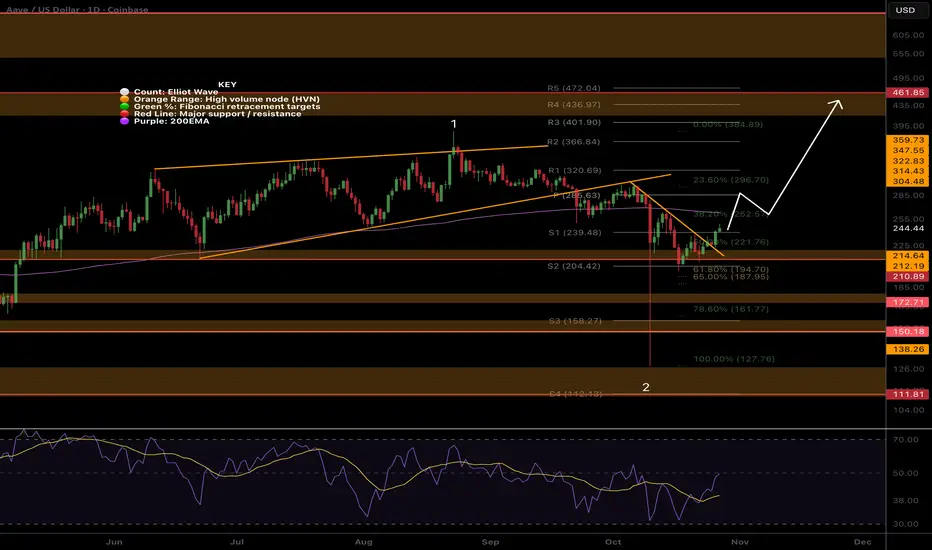
AAVE local analysis updated, Bear trend continueEURONEXT:AAVE Locally, price continues bearish after falling out of the wedge, completing wave 1. Until the price gets above the orange descending trend-line, the probability is downside continuation.
Wave 2 appears complete after the big drop, black swan event. I was looking for a dip back into the long lower wick, which we have and price found support. This suggests we grind higher from here, but we must get through the daily 200EMA, just above the High Volume Node resistance and daily pivot. This area will be tough to crack.
The alternative count is a triangle forming discussed below, which is the (A)(B)(C) shown.
📈 Daily RSI has printed bullish divergence from the oversold threshold, which is bullish and a bottoming signal.
👉 Continued downside has a next target of $150.
Safe trading

AAVE Bullish structure from supportEURONEXT:AAVE has printed bullish structure from support but the daily 200EMA looms ahead, once cracked AAVe should move well. Price tested the golden pocket Fibonacci retracement.
AAVE did not pullback as much as most alt-coins and is expected to be one of the first to break into all time high / price discovery. First target is $460 High Volume Node.
Daily RSI almost hit oversold twice in what looks like a double bottom
Analysis is invalidated if we drop below $187
Safe trading
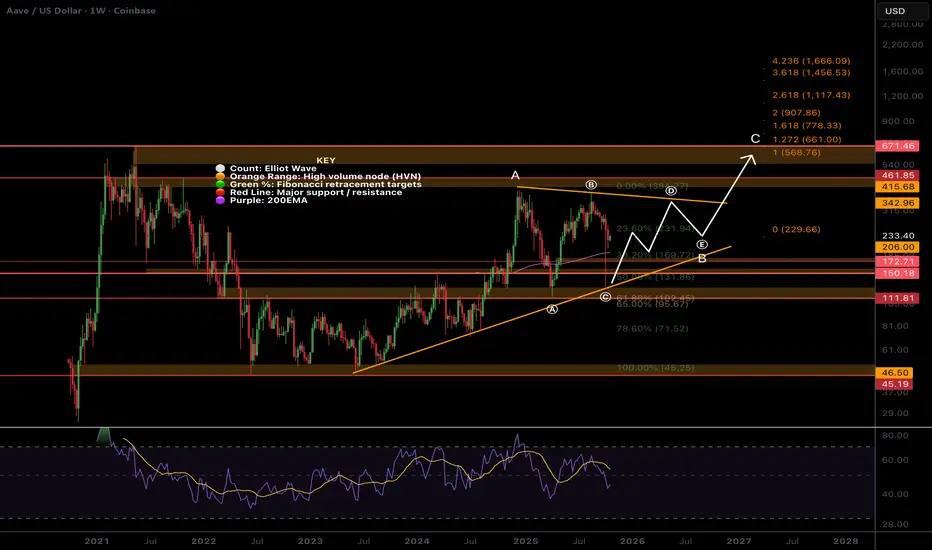
AAVE Macro changed... Another huge triangle?EURONEXT:AAVE macro has changed with the recent price action. We appear to printing a multi-year macro triangle in wave B, with wave (C) now complete on last weeks wipeout.
Price touched the S1 pivot and High Volume Node support just above the golden pocket.
Weekly RSi still has room to fall with no bullish divergence yet. The next longer term target will be the pivot point and the top of the first wave of wave D, $260, followed by the triangle upper boundary at ~$340. Breaking out of the triangle has a first target of the all time high at $670. Not what AAVE investors want to see but still a x3 from here.
Price is above the weekly 200EMA but only just.
Analysis is invalidated if we fall below wave (A), $102 and will liley see a slow death to $45 if this happens.
Safe trading
AAVE local whats next? Total alt-coin leverage wipeout!What a mess Friday turned out to be with a recording breaking liquidation event with the numbers still growing - bigger than FTX!
SUNK COST FALLACY: THE DAMAGE IS DONE, DO NOT PANIC IN AND OUT OF POSITIONS.
So many alt-coins proved there is nothing but thin air holding them up - no real demand whatsoever! I'll take a look at some charts today. Now these wicks can be classed as 'anomalies' in technical analysis but in this case i think we've revealed some of the strong tokens now with real backing.
It is expected that with such large wicks we at least test the centre of the wick on one more terrifying shake-out that isnt actually as bad as the one we just has but feels it because traders and investors are been kicked while their down in a state of panic.
-------------
Price printed a topping wedge, broke down, tested as resistance and dropped. The drop was likely anyway but the extent of systematic failure made it worse.
Aave did not penetrate the lows of the larger range and found support in the High Volume Node all the way back to the 0.5 Fibonacci retracement and is now back testing the daily 200EMA as resistance.
Wave 2 is likely complete. We probably visit the wick on a scary candle to $209 High Volume Node before finding a bottom for a huge wave 3 of 3 move up to new highs! A likely scenario now that we have shaken out all the weak hands.
These events often mark the bottom. Daily divergence is not oversold or has bullish divergence yet. The macro structure is still in tact!
Safe trading

AAVEUSD #bullishSince reaching its lowest point in June 2022, AAVE has shown a consistent pattern of accumulation and range-bound trading, fluctuating between $107 and $48. This behavior indicates a strong setup for an upward trend.
Reasons for a Bullish Outlook:
The Relative Strength Index (RSI) on a weekly basis remains steadily above 50%, signaling strength in the market.
The price has been consistently consolidating above the 200-week Exponential Moving Average (EMA), suggesting a solid support level.
A breakout has been observed from a two-year downtrend, indicating a potential reversal in market sentiment.
The weekly EMA ribbon has turned bullish, further reinforcing the positive outlook.
Detailed analysis and additional insights are provided on the accompanying chart, highlighting these bullish indicators.
2 potentials for midterm
Additionally, for AAVEBTC, a significant point to monitor is the heavy resistance at 0.0026 sat. It's crucial to watch for this level and a breakout of the RSI above 54% on a weekly basis, which could indicate a strong upward movement

STABLECOIN SUPERCYCLE CAN SEND AAVE TO $5,000We have a #HVF forming that is yet to breakout.
The fundamental driver is of course stablecoin growth. Namely the ones that the United States allow to dominate in this space. Permissioned quasi CBDC's like USDT and USDC.
So what is AAVE if you don't know;
Aave (AAVE) is a decentralized finance (DeFi) protocol enabling users to lend, borrow, and earn interest on crypto assets without intermediaries through automated liquidity pools.
Liquidity Markets – Users deposit assets into pools to earn yield or borrow against collateral.
Flash Loans – Pioneered uncollateralized loans executable within a single blockchain transaction.
Community Governance – AAVE token holders vote on protocol upgrades, risk parameters, and expansions.
So there we have it ... congrats to hodler's of this protocol that was once called ETHLend.
Theres still plenty meat left on the bone for these next few years.

AAVE Breakdown from wave 5 wedge. Whats next?Local Analysis / Targets / Elliot Wave
CRYPTOCAP:AAVE broke down out of the wave (5) of 1 wedge per my previous analysis reaching the paths first target to find support the daily 200EMA and S1 pivot point. If price continues lower I expect it to bounce first before delivering a final thrust down in wave C of 2.
The major support High Volume Node, $210, is the target at the 0.5 Fibonacci retracement. Further breakdown brings up the golden pocket and S2 pivot, $175, and the alt-coin ‘golden pocket’ sits at $149 the 0.786 Fibonacci retracement. This is the most common area for alt-coin pull backs to terminate and a characteristic area for low volume, highly volatile assets in general due to the psychology as I discuss on my Fibonacci tutorial on YouTube.
RSI is making its way down into oversold but has plenty of room to fall with no bullish divergence yet.
Standard Deviation Band Analysis
Standard deviation bands are non-normally distributed unlike the renko chart shared in yesterdays report when time is removed. Price continues to spend way to much time at extremes with fast movement through the fait value zone. Bands are shifting significantly positive as time goes on due to price spending so much time in th eupper boundaries. This is a good sign of strength, dips remain shallow showing strong demand.
Price is testing the SD+2 threshold as support now and losing this would bring up the next target of the fair value regression line at $150 which adds confluence to the alt-coin ‘golden pocket’ targets in the technical analysis.
Safe trading
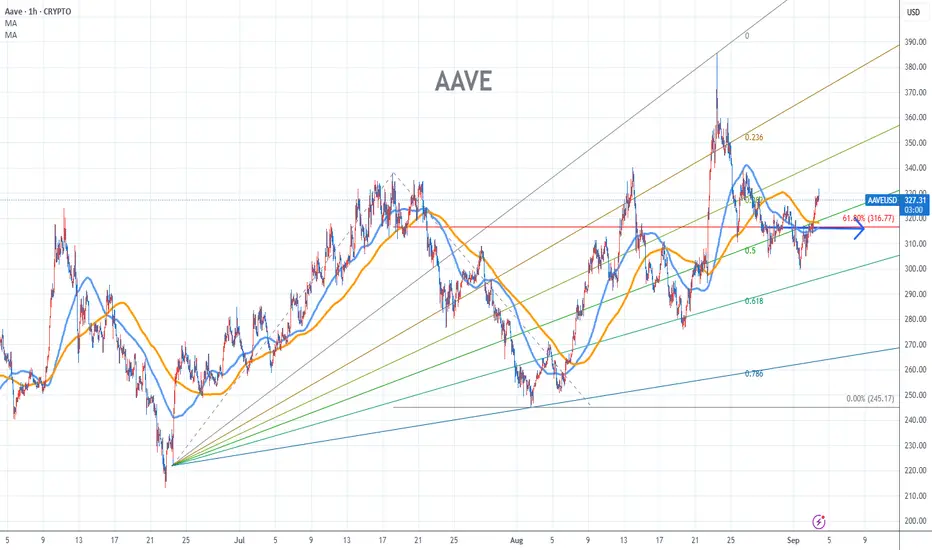
AAVE Stock Chart Fibonacci Analysis 090325Trading Idea
1) Find a FIBO slingshot
2) Check FIBO 61.80% level
3) Entry Point > 316/61.80%
Chart time frame:B
A) 15 min(1W-3M)
B) 1 hr(3M-6M)
C) 4 hr(6M-1year)
D) 1 day(1-3years)
Stock progress:A
A) Keep rising over 61.80% resistance
B) 61.80% resistance
C) 61.80% support
D) Hit the bottom
E) Hit the top
Stocks rise as they rise from support and fall from resistance. Our goal is to find a low support point and enter. It can be referred to as buying at the pullback point. The pullback point can be found with a Fibonacci extension of 61.80%. This is a step to find an entry-level position. 1) Find a triangle (Fibonacci Speed Fan Line) that connects the high (resistance) and low (support) points of the stock in progress, where it is continuously expressed as a Slingshot, 2) and create a Fibonacci extension level for the first rising wave from the start point of the slingshot pattern.
When the current price goes over the 61.80% level, that can be a good entry point, especially if the SMA 100 and 200 curves are gathered together at 61.80%, it is a very good entry point.
As a great help, TradingView provides these Fibonacci speed fan lines and extension levels with ease. So if you use the Fibonacci fan line, the extension level, and the SMA 100/200 curve well, you can find an entry point for the stock market. At least you have to enter at this low point to avoid trading failure, and if you are skilled at entering this low point, with the fibonacci6180 technique, your reading skill of to chart will be greatly improved.
If you want to do day trading, please set the time frame to 5 minutes or 15 minutes, and you will see many of the low points of rising stocks.
If you prefer long-term range trading, you can set the time frame to 1 hr or 1 day
AAVE/USD – Stuck Below SMA200🔴 SHORT below $328.68 – target $318.97
AAVE trades at $326.6, just under its 200 SMA ($328.68). Resistance is capped at $328.80, while support lies at $318.97. RSI at 56 shows balanced momentum. A rejection below $328.68 risks pullback toward $319.

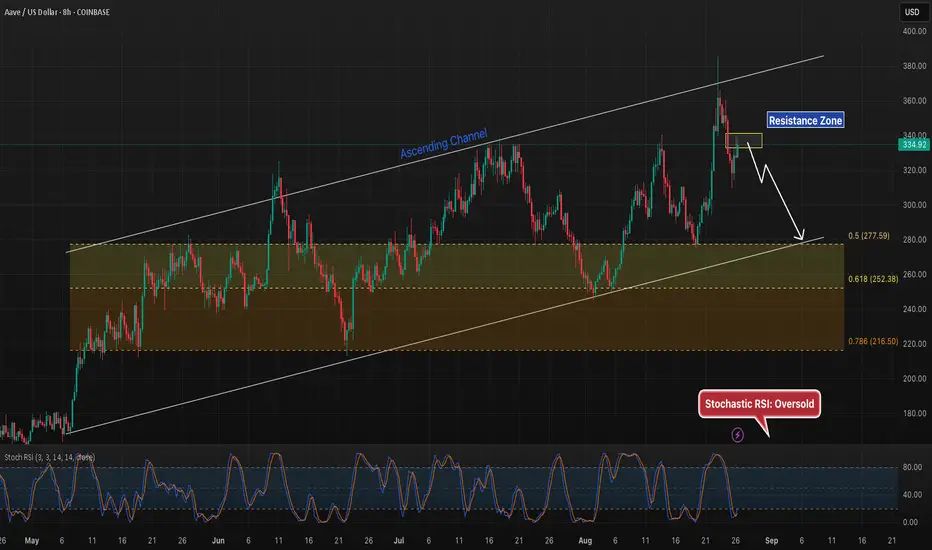
AAVE 8H – Resistance Hit, Watching Channel Support NextAAVE is trading inside an ascending channel, rejecting from resistance near 334.
Bearish path: Rejection at the yellow resistance zone sets up a pullback toward the Fib Golden Pocket, aligned with channel support around 277–252.
Bullish path: A sustained reclaim above resistance would shift momentum, putting higher channel levels back in play.
With Stoch RSI oversold, momentum could support a short-term bounce, but the reaction here decides if AAVE holds trend or tests deeper support.
AAVE Ending Diagonal?We have some more clarity with the local AAVE pattern and it does appear to be an Elliot wave ending diagonal. After a strong wave 3 ending diagonals form as a terminal pattern with a thrust above the trend line threshold and drop back down to complete a higher degree motif wave 1.
The following retracement has a high probability of terminating at the wave 4 bottom which in this case is at the High Volume Node support and 0.5 Fibonacci retracement at $210.
RSI has printed a series of bearish divergence from overbought but this took a long time to play out!
Analysis is invalidated if price breaks above $400.
Safe trading

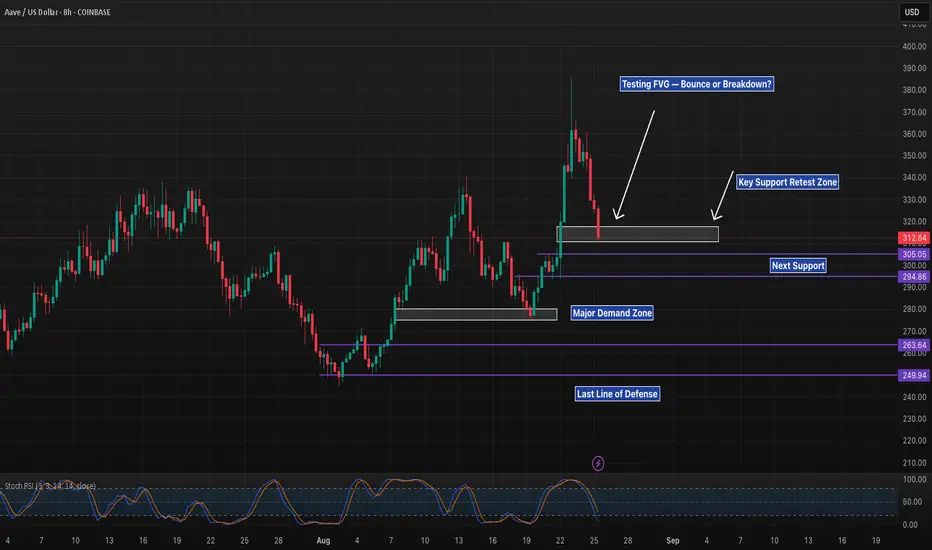
AAVE 8H – Retesting Support, Will Bulls Defend $305?AAVE has pulled back sharply from the recent spike near $327 and is now retesting the highlighted support zone around $312–305. This area is critical since it served as a strong breakout base earlier.
Below current price, the next support levels line up at $295, $264, and $250 — each representing deeper demand zones. A decisive breakdown of $305 could shift momentum back toward the broader downtrend, while a successful defense here may fuel another leg higher.
The Stoch RSI is entering oversold territory, hinting at possible relief. However, price structure will ultimately dictate direction — a clean reclaim and higher low formation could favor bulls, while sustained weakness risks continuation to the downside.
Traders should watch the $305 zone closely for confirmation.
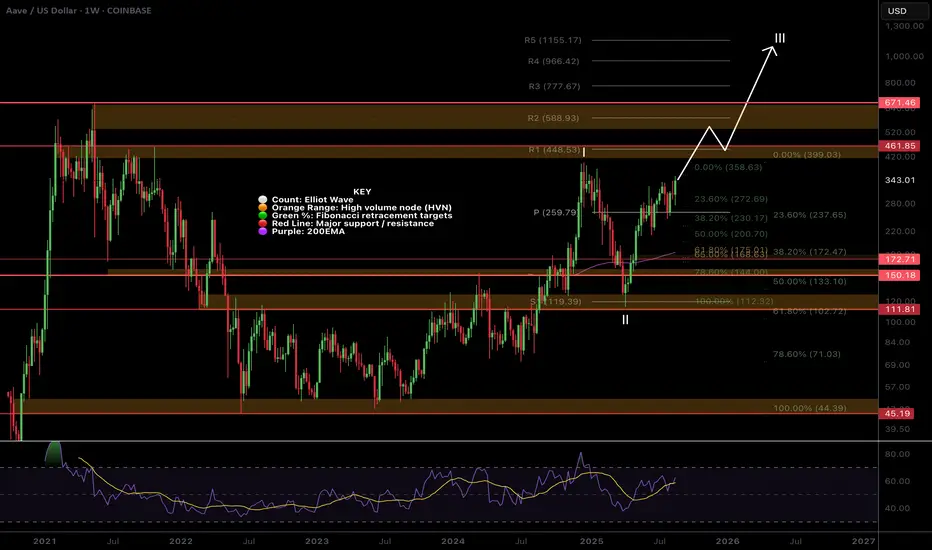
$AAVE Set for all time high?AAVE tested the weekly pivot as support and after a secondary pullback to the 0.236 Fibonacci retracement, sky rocketed alongside BTC and crypto yesterday to a new local high.
Wave III looks truly underway with this kind of price action and the target remains the R5 weekly pivot at $1155. High Volume Node resistance at $460 and $670 are the next targets.
Weekly RSI has plenty of room to grow to get to overbought.
Analysis is invalidated below $111 so plenty of room to breathe!
Safe trading
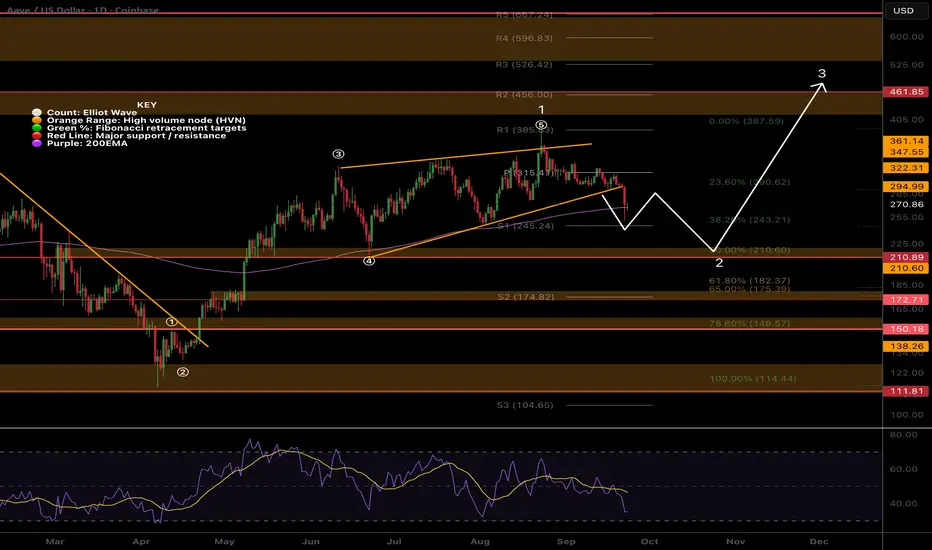
$AAVE Local Expanded Flat Correction?CRYPTOCAP:AAVE Elliot wave count could be printing an expanded flat correction in wave 2.
5 waves up complete a motif wave with daily RSI in overbought. 3 clear waves down for wave A (or X) was next followed by a poke above all time on confirmed bearish divergence.
If the count is correct then our first target would be a swing below wave A and the ascending daily 200EMA at point . Further decline in wave C (or Z) brings up the previous wave 4 target and the High Volume Node major support $210 point
A steeper decline in wave 2, aligning with my September dump idea, brings up the golden pocket at but a more likely target is the alt-coin golden packet at 0.786, s3 daily pivot and High Volume Node support . This would be a great buy opportunity for me.
Safe trading

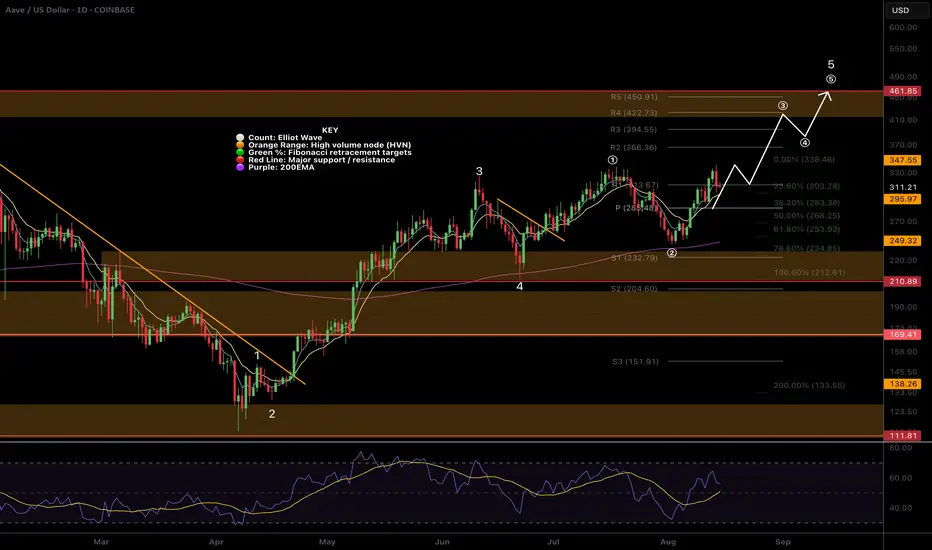
$AAVE Continues to follow the path!CRYPTOCAP:AAVE was immediately reject from the swing high as expected, per the percentage band take profit rules.
Daily RSI has plenty of room to grow to reach the all time High Volume Node resistance which is the next target at $430.
Based on the depth of wave (2) after touching the daily 200EMA as support, wave 3 is still underway to complete the larger degree wave 5 with a poke above all high, the highest probability terminal target per Elliot wave rules.
Safe trading
For those interested in trading signals / diary & trade management / trading parameters etc... Signals updated for 15/08/25
✅ LSE:ONDO DEMA Percentage Band rule added
✅ CRYPTOCAP:BTC hit take profit #2 for 2.59RR
✅ CRYPTOCAP:AAVE (DEMA) HIt take profit 1 for 1.45RR
✅ CRYPTOCAP:ADA moved 10% after signal activation but still not hit take profit 1
✅ NASDAQ:AAPL (Apple) very close to take profit #1
✅ BTC added to completed trade signals along side Take profit 2 for google, 700, HBAR and a few stop (INJ, SOL, BTDR) and invalidations for META, SHIBINU, WLD)
Safe trading
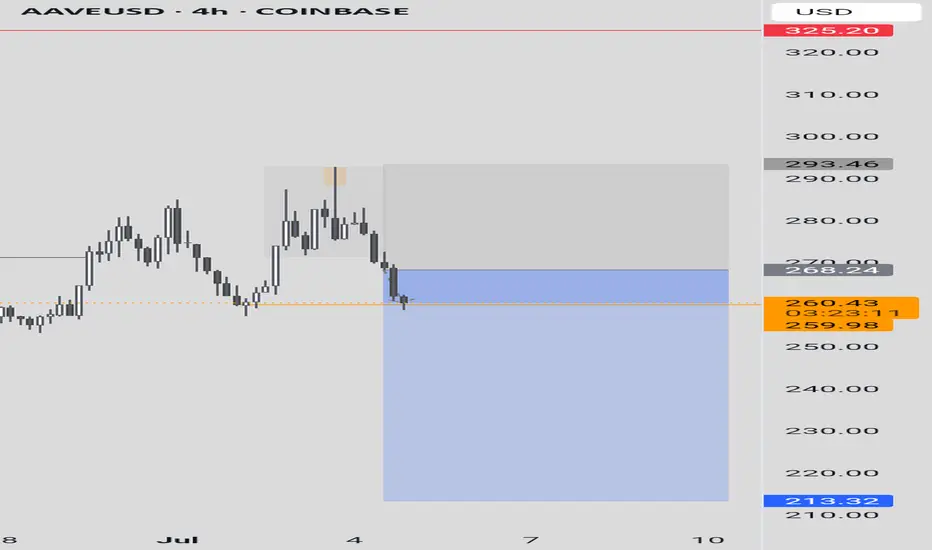
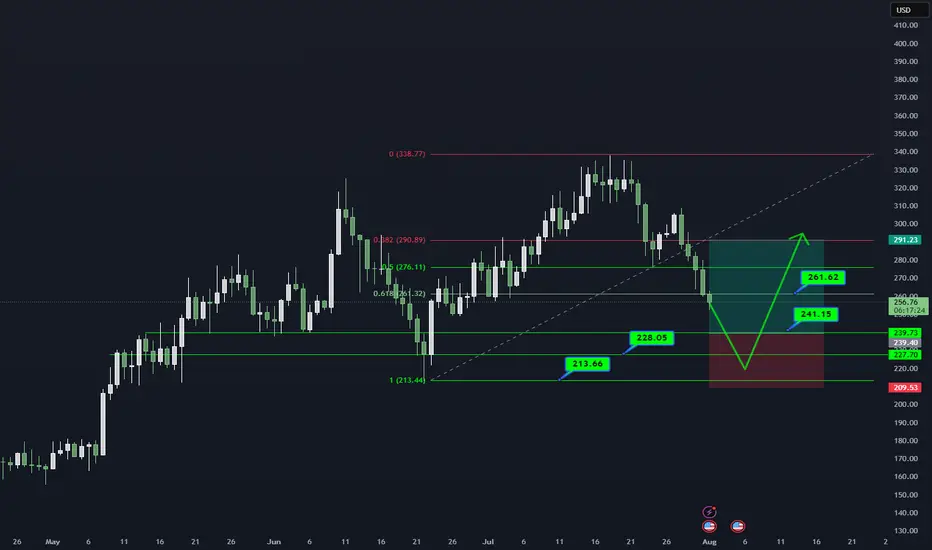
AAVE/USDT DAILY OUTLOOK📊 AAVE/USDT – DAILY TECHNICAL OUTLOOK
🔍 MARKET STRUCTURE
AAVE critical demand zone (241–228) par trade kar raha hai.
Higher timeframe trend bullish jab tak 213 strong base hold karta hai.
📌 KEY LEVELS TO WATCH
Support Zones: 241.15 → 228.05 → 213.66 (Major Base)
Resistance Zones: 261.62 → 291.23
Breakout Confirmation: Daily close above 261 could open path to 291.
🎯 TRADING PLAN (25% SCALING STRATEGY)
Entries ko 25% ke 4 parts me divide karein:
241.15
228.05
220–213 support range
Targets: 261.62 → 291.23
Stop Loss: Daily close below 213
⚠️ RISK MANAGEMENT NOTE
Spot trades safer. Leverage trading = technical gambling.
Capital preservation = long-term survival.
📖 QUOTE
"The big money is made by sitting, not trading." – Reminiscences of a Stock Operator
💬 WHAT’S YOUR VIEW ON AAVE?
Bullish bounce from demand zone or deeper retest ahead?
Share your thoughts in the comments!
#AAVE #CryptoTrading #Altcoins #TradingView #TechnicalAnalysis #CryptoCommunity #RiskManagement #SpotTrading
AAVE Long The daily is currently making HH / HL testing the daily 50 ema and ascending trend line
The 1h was a perfect entry, ascending triangle break out and re/test of the 1h 50 ema, fib levels and making a higher low

$AAVE Daily Hidden Bullish divergence?CRYPTOCAP:AAVE and alts begin their retracement Wednesday but is this a long term top or just local? Im betting we have a higher to go this summer..
Hidden daily bullish divergence is printing on RSI at the daily pivot and 0.5 Fibonacci retracement which should all act as strong support provided BTC doesn't dump.
The 'alt-coin golden pocket' Fibonacci retracement 0.786 sits at the descending daily 200EMA and High Volume Node support offering a secondary target for reversal and continued upside.
Losing this and closing below would flip me bearish until a new bullish signal emerges.
Safe trading.

$AAVE Macro outlook Grinding the PathCRYPTOCAP:AAVE continues to grind higher poking above the swing high which was rejected to test the weekly pivot and .382 Fibonacci retracement as support successfully. This was a shallow wave 2 so I am expecting a big thrust up in wave 3. However, the alternative count could suggest a wave is only completing now with wave 2 actually being wave (4) of 1, this would be the case if price falls back below $171.
Weekly RSI is still bullish with plenty of room to rise ahead of it. It printed a weekly bullish divergence at the wave II low and major support high volume node.
AAVE is definitely one too watch this cycle.
Safe trading

$AAVE Ready to Pop?EURONEXT:AAVE long signal is now active.
Price is still well above the daily pivot and daily 200EMA showing a strong local trend.
I am still expecting a decent move to test the all time high, High Volume Node at $460.
Safe trading

AAVEUSDT Cryptocurrency Futures Market Disclaimer 🚨🚨🚨
Trading cryptocurrency futures involves high risks and is not suitable for all investors.
Cryptocurrency prices are highly volatile, which can lead to significant gains or losses in a short period.
Before engaging in crypto futures trading, consider your risk tolerance, experience, and financial situation.
Risk of Loss: You may lose more than your initial capital due to the leveraged nature of futures. You are fully responsible for any losses incurred.
Market Volatility: Crypto prices can fluctuate significantly due to factors such as market sentiment, regulations, or unforeseen events.
Leverage Risk: The use of leverage can amplify profits but also increases the risk of total loss.
Regulatory Uncertainty: Regulations related to cryptocurrencies vary by jurisdiction and may change, affecting the value or legality of trading.
Technical Risks: Platform disruptions, hacking, or technical issues may result in losses.
This information is not financial, investment, or trading advice. Consult a professional financial advisor before making decisions. We are not liable for any losses or damages arising from cryptocurrency futures trading.
Note: Ensure compliance with local regulations regarding cryptocurrency trading in your region.
thanks for like and follow @ydnldn to have more information outlook and free signal.
About me :
"I am a passionate swing trader focused on analyzing financial markets to capture profit opportunities from medium-term price movements. With a disciplined approach and in-depth technical analysis, I concentrate on identifying trends, support-resistance levels, and price patterns to make informed trading decisions. I prioritize strict risk management to protect capital while maximizing profit potential. Always learning and adapting to market dynamics, I enjoy the process of refining strategies to achieve consistency in trading."