Aave (AAVE): Looking For Continuation of Bullish TrendAAVE had a clear trend switch earlier and since then price has been trading inside a clean bullish structure. Right now we are sitting just behind the EMAs, which is the main area to watch in the short term.
If buyers manage to break and reclaim the EMAs, then we look for continuation of the bullish trend inside the current range. As long as price holds within these borders, the game plan stays the same.
Swallow Academy
Market insights

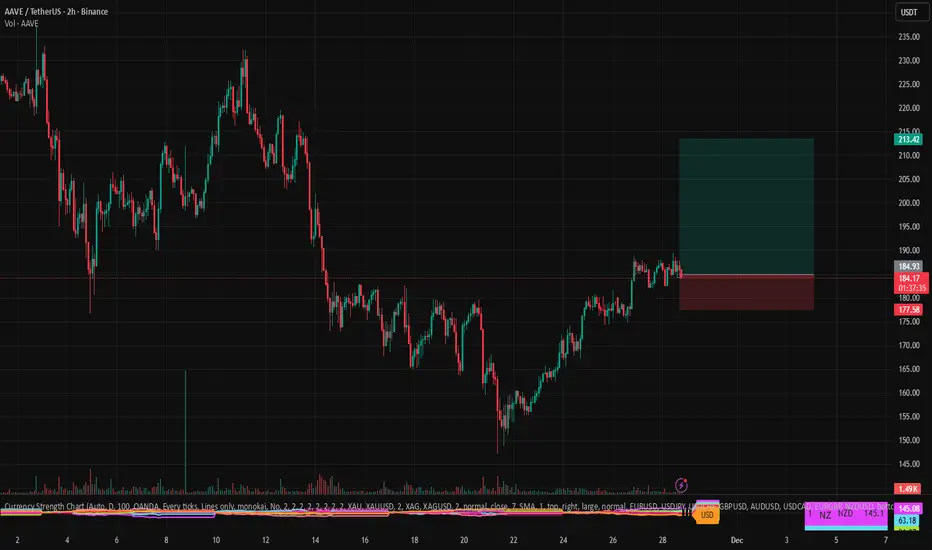
AAVE can HOLD?A Good trade from here if it holds.
Entry Under 180.00 with invalidation on breaking current area.
Expecting Bullish Trend if holds here.
Note: Not a Financial Advice.

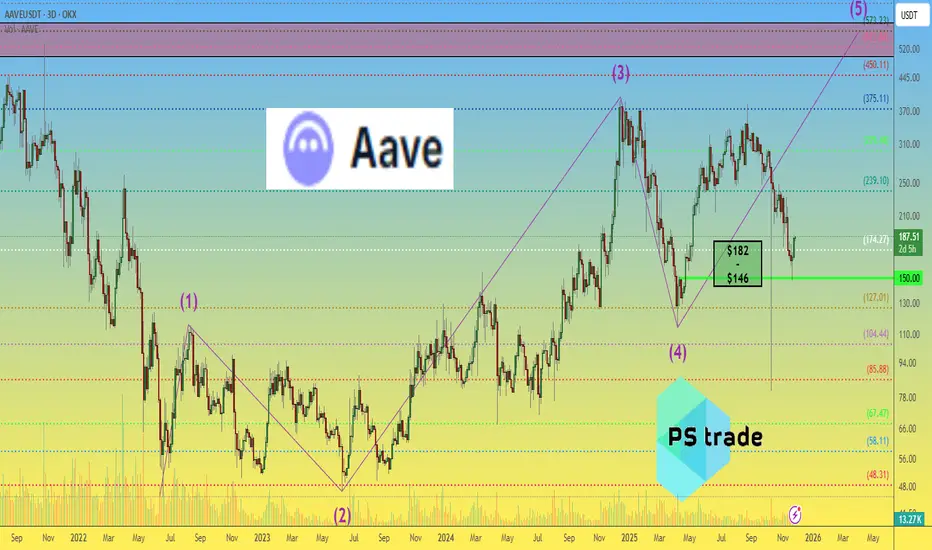
AAVE ANALYSIS (1D)Hello everyone.
Today I'm going to examine AAVE.
As you can see after a five upward impulsive wave, AAVE has faced a double Zig-Zag correction.
The reason why this pattern is a Double Zig-Zag is simply because the first A-B-C correction was not enough. Therefore another Zig-Zag correction was needed.
This kind of corrections only appears in the market when the main correction wave is not enough to balance the price according to the last impulsive wave.
There are two scenarios comes forward;
First: If it's a double Zig-Zag correction, there is always another possibility that this pattern could turn itself into a triple Zig-Zag. In this case, the mini wedge pattern you see on the chart will break the last low and create a way deeper correction. Target of a possible triple Zig-Zag is marked on the chart.
Bullish scenario: If the double Zig-Zag has ended which is what I'm seeing at the moment, the 4H ascending wedge you see on the chart will create a leading diagonal and a higher high, which will be seen as wave 2 for another five wave upward impulsive move. That's the opportunity you can't afford to miss.
Fortunately, the risk management comes very easy when Elliott patterns are clear.
If you're looking for a swing long position in here your stop-loss should be last low, just below the Wave Y. To make it better, wait for a daily candle close below it, so you won't be hunted for liquidity grabs.
Target of the possible wave 3 is marked on the chart as well.

Bulls Flexing StrengthHey guys, AAVE is setting up one of those textbook bullish continuation patterns that makes you sit up and pay attention.
The current price of $199.14 sits right in the equilibrium zone, perfectly balanced between premium and discount levels. What's immediately striking is the clean higher low formation that's been confirmed, with price holding firmly above all major moving averages. The EMA20 at $197.14, EMA50 at $196.87, and EMA200 at $193.39 are all stacked bullishly beneath current price, creating a support ladder that's characteristic of strong uptrends. This alignment doesn't happen by accident - it's the result of sustained buying pressure and institutional accumulation.
The ADX reading of 53.3 is absolutely critical to understanding the current market state. This indicator measures trend strength, and anything above 25 signals a trending market rather than choppy consolidation. At 53.3, we're looking at a strong, established trend that has momentum behind it. When you pair this with the MACD showing powerful bullish divergence (0.6012 vs 0.0205 signal line), the technical picture becomes crystal clear. The MACD histogram is expanding positively, indicating accelerating bullish momentum rather than a weakening trend.
The RSI at 68.7 is approaching overbought territory but hasn't reached extreme levels yet. This is actually ideal for continuation setups - we want to see strength, not weakness. The RSI has room to push into the 70-80 zone during strong trending moves, so this reading suggests we're in the middle of a move rather than at an exhausted top. The MFI at 66.8 confirms that money flow is supporting this price action, with capital flowing into AAVE rather than exiting.
From a Smart Money Concepts perspective, this setup gets even more interesting. Price is currently trading above a bullish order block that spans $196.09 to $197.71. This zone represents an area where institutions likely accumulated positions during the previous move up, and it's now acting as a demand zone. Order blocks are one of the most reliable SMC concepts because they mark areas where smart money has shown their hand. The fact that we're holding above this level suggests institutional support remains intact.
There's also an unfilled bullish Fair Value Gap sitting at $195.26-$195.54. FVGs represent inefficiencies in price action where the market moved too quickly, leaving behind an imbalance. These gaps act as magnets - if we see any pullback, this $195.26-$195.54 zone would be an ideal area for smart money to add to positions. It's essentially a discount entry point within the broader uptrend.
The bearish order block at $204.48-$199.70 represents the immediate supply zone we need to reclaim. This is where sellers previously showed strength, and reclaiming this zone with volume would be a significant bullish signal. A break above $204.48 with expanding volume would likely trigger stops and fuel a move toward the swing high at $206.80.
The market structure is showing higher lows, which is the definition of an uptrend. The recent swing low at $189.16 held firm, and the even stronger low at $186.85 provides an additional backstop. The Bollinger Bands show price trading above the middle band at $195.32, with the upper band at $202.02 within striking distance. When price walks the upper Bollinger Band in a strong trend, it often signals continuation rather than reversal.
Volume analysis reveals current levels at $19,995 versus an average of $22,867. While this is slightly below average, it's not concerning given we're in a consolidation phase. What we want to see is volume expansion as price approaches the $204.48 resistance zone. A breakout on declining volume would be suspect, but a breakout with volume above $25,000+ would confirm institutional participation. The 24h volume of $161 million shows healthy overall interest in AAVE.
The wick analysis is particularly revealing. The lower wick represents 24.9% of the candle range, while the upper wick is only 11%. This asymmetry tells a story - buyers are aggressively defending lower prices (creating large lower wicks), while sellers aren't showing the same aggression at higher prices (small upper wicks). This imbalance in supply and demand dynamics typically precedes upside moves.
For a complete trading setup, here's how I'd approach this: Entry zone is $197-199, with aggressive traders potentially entering at current levels given the strong technical backdrop. More conservative traders might wait for a pullback to the $195.26-$195.54 bullish FVG for a better risk-reward entry. The stop loss should be placed below $188.00 - a 4H close beneath the discount zone at $188.09 would invalidate the bullish market structure and break the higher low formation. This isn't just a random percentage-based stop; it's a structural level where the thesis breaks.
Target the swing high at $206.80 for TP1, which represents a 3.85% move from current levels. If we get a clean breakout above $206.80 with volume confirmation, look for extension targets at $210 and potentially $215 based on measured moves. The risk-reward on this setup is approximately 1:2.5 from current levels, which is solid for a continuation play. If entering from the FVG around $195, the R:R improves to nearly 1:4.
The confidence level on this setup is 78% - high conviction but not maximum. What keeps this from being a 90%+ setup is the slightly below-average volume and the fact that we're in equilibrium rather than deep discount. The ideal scenario would be a quick wick down to $195 on a volume spike (liquidity grab), followed by immediate reclaim and push through $204.48. That would be the textbook smart money playbook.
Alternative scenarios to consider: if price rejects hard at the $204.48 bearish order block without volume confirmation, we could see a deeper pullback to the $195.26 FVG or even the $189.16 swing low. This wouldn't invalidate the bullish thesis unless we close below $188.00. Consolidation between $197-204 for another 12-24 hours would actually be healthy, allowing the RSI to cool off slightly before the next leg up.
What are you thinking here? Are you waiting for a pullback to the FVG for a better entry, or taking the trade at current levels given the strong momentum?

AAVE/USDT LONGEntry: $184–186.5
SL: $169.9
TP: $195.5–202
Risk: 1%
Long from the local 4h base around the daily demand zone 178–185 after a liquidity sweep below 180 and successful defense of support, targeting a rebound into the upper bullish FVGs and supply zone at 195.6–202+, with potential extension toward the higher cluster $208–220.
Fundamental driver: Aave controls ~72% of the crypto lending market, generates about $90M in monthly revenue and is widening its lead over Spark; whales have added 50k+ AAVE over the last 30 days and now hold an all‑time high of 3.98M tokens, continuing to buy into dips, while one major address is repeatedly using recursive borrowing to accumulate more AAVE. The SEC has officially closed its investigation and did not classify AAVE as a security, removing a key regulatory overhang and opening room for repricing a DeFi blue chip whose tokenomics actually capture protocol fees and value (unlike cases such as Plasma). The setup is counter to the local “total bearish” EMA regime, so execution should be via lower‑TF reaction and partial entries within the range, with staggered profit‑taking at liquidation clusters and FVGs; the idea is fully invalidated on a sustained break below $170 and a clean loss of trend support.

AVEE. USDTWithout a doubt, one of the best cryptocurrencies is AAVE.
With 16 million tokens, all of which have already been issued to the market.
While most cryptocurrencies either have billions of tokens or an infinite supply, Ripple has 100 billion, Dogecoin has an infinite supply, and...
Even Bitcoin has 21 million tokens. (Although not all of them have been mined.)
Of course, there are many high-potential cryptocurrencies like AAVE, such as Avax, Uni, Link...
Therefore, a successful investment is investing in high-potential cryptocurrencies.
Note:
When and at what price should you buy AAVE, and when exite the market?
However, AAVE is currently adjusting its price.
I'm considering a price range of $120 to $140.
What do you think?

NLDN | AAVEUSDT AAVE/USDT (4H):
Market Conditions: The price is in a correction (downward) phase after failing to break through the above resistance.
Key Areas:
Resistance: $195 - $205 (Orange Zone), where the price is struggling to rise.
Support: $150 - $170 (Blue Zone), a potential buy area to halt the decline.
Movement Prediction: The chart indicates the price will likely fall first to the $160 range before determining its direction: whether it will bounce back up or continue falling below $140.
Sentiment: Tends to be bearish (weakening) in the short term as long as the price is below the diagonal trendline.

AAVEUSDT 1D#AAVE is moving inside a descending channel on the daily chart. Since it is currently interacting with the Ichimoku cloud and the daily SMA50, you can consider buying a small bag here and another position near the support zone. In case of a breakout above the channel, the potential targets are:
🎯 $227.60
🎯 $252.46
🎯 $277.31
🎯 $312.70
🎯 $357.78
⚠️ Always remember to use a tight stop-loss and maintain proper risk management.

AAVE Eyes Bullish Reversal: Demand Zone Loading!BINANCE:AAVEUSDT is maintaining a strong bullish structure after a confirmed CHoCH followed by multiple Bullish BOS signals. Price is now pulling back into the $184.78–$181.24 demand zone, which is the key area to watch for a potential long opportunity.
If buyers defend this zone and we see a bullish reaction, upside targets remain $190 and $200.
A breakdown below $180 invalidates the setup and opens the door for deeper downside movement.
This demand zone will determine whether AAVE continues its bullish momentum or shifts into a deeper correction.
Stay patient and use proper risk management.
#AAVEUSDT #CryptoAnalysis #SmartMoneyConcepts #TradingView

AAVE SHORT TRADE SETUPNew Trade Setup: AAVE-USDT
SHORT
Entry: 185.32 or CMP
Target: TP1: 177.08, TP2: 168.84, TP3: 160.60, TP4: 152.36
Stoploss: 197.91
Leverage: 1X
Technical Analysis: AAVE/USDT is rejecting from key Resistance on higher timeframe with a high probability of moving down to test the next support level.

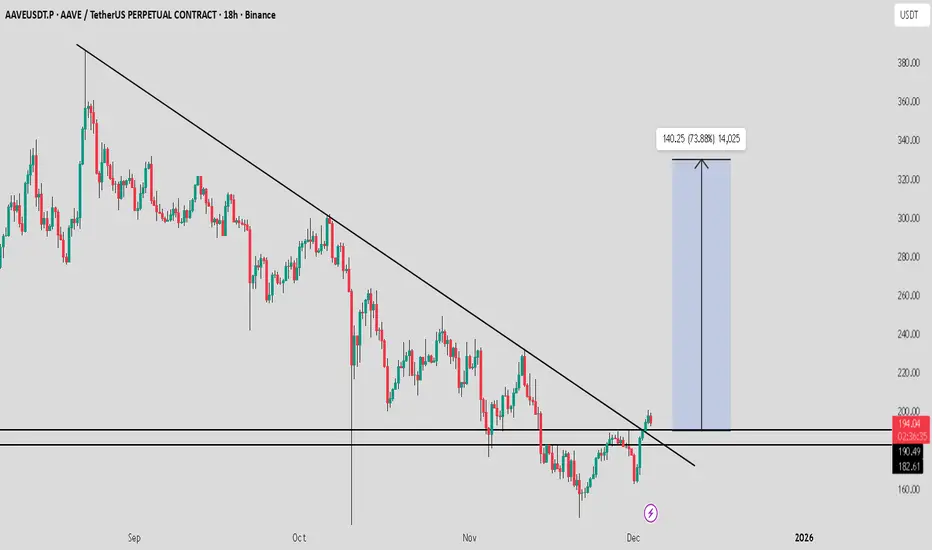
AAVE in Rising Wedge Near Major Descending TrendlineAAVE is forming a clear rising wedge structure after rebounding from the lower demand zone. Price is making higher highs and higher lows, but the range is tightening, showing loss of bullish momentum as it pushes into a major descending trendline.
This rising wedge is developing against higher timeframe resistance, which increases the probability of rejection. If price fails to break and hold above the descending trendline, the structure is likely to resolve to the downside. In that case, the next key demand area sits around one sixty to one sixty five.
For the bullish scenario, AAVE must break above the descending trendline with strong acceptance and volume. Such a move would invalidate the bearish wedge structure and open the path toward the two hundred to two hundred five resistance zone.
This setup is driven by rising wedge dynamics, trendline confluence, and structure compression. The reaction at resistance will define whether price continues higher or resumes the broader downtrend.
Confirmation is essential before taking directional trades.

AAVE/USDT — Critical Demand Zone 135–120: Reversal Signal?AAVE/USDT (3D) is developing a highly interesting structure after delivering a strong rebound from the major demand zone at 135–120, an area that has historically served as a large accumulation region for institutional players since 2023.
The long downward wick — clearly a liquidity sweep — shows how the market wiped out stop-losses beneath the zone before snapping back upward. This kind of wick is rarely random; it often signals smart money accumulation exactly where retail traders panic.
Still, despite the sharp recovery toward 180–190, the broader market structure remains in a pattern of Lower Highs, which means the medium-term trend is still technically bearish. AAVE is now positioned at a major inflection point: Is this the beginning of a structural reversal, or only a temporary bounce before another leg down?
---
🔵 Bullish Scenario — Reversal Begins Above 205
The bullish case gains real validity only if price can break and close above the 195–205 resistance cluster on the 3D timeframe.
A decisive breakout here would mark the first Higher High in months and potentially flip the trend.
If the breakout holds, upside targets include:
Target 1: 265–305 (major supply zone)
Target 2: 380–400 (macro swing high)
Target 3: 440+ if DeFi momentum expands
Key bullish confirmations:
Increasing buy volume during the breakout
Strong 3D candle close above 205
A clean retest of 195–205 turning into support
If these align, a full trend reversal becomes increasingly probable.
---
🔴 Bearish Scenario — Breakdown Below 120
The bearish case becomes dominant if price fails to defend the 135–120 demand block and instead closes firmly below 120 on the 3D timeframe.
If that happens, the mid-term downtrend likely resumes with the following targets:
Target 1: 99–84
Target 2: 70 (previous liquidity sweep low)
Target 3: 62 if capitulation expands
This scenario would suggest that the prior liquidity sweep was not a reversal signal but rather preparation for a deeper markdown phase.
---
📌 Key Patterns & Structural Notes
Liquidity Sweep: The long wick beneath the demand zone signals wiped-out liquidity and possible institutional absorption.
135–120 Demand Block: A crucial accumulation area that currently serves as the final defense for buyers.
Lower High Structure: Trend remains bearish until 205+ is reclaimed.
Range Market: Price is currently oscillating within a broader 120–225 range; a breakout of either side will determine the next macro move.
---
🎯 Final Summary
AAVE is now at one of its most important decision zones of the past year.
Break above 205 → bullish trend shift
Break below 120 → bearish continuation and deeper lows
Until one of these triggers is activated, AAVE remains in accumulation/consolidation mode, preparing for its next major directional move. Swing traders typically wait for one of these confirmations before entering large positions.
---
#AAVE #AAVEUSDT #CryptoAnalysis #PriceAction #TechnicalAnalysis #SupplyDemand #LiquiditySweep #DeFi #Altcoins #CryptoMarket

AAVE Holding Strong — Watching for Breakout Reaction Toward $250AAVE / USDT is holding strong above the marked horizontal levels. If price reacts with clear strength from this zone, it could offer a solid opportunity for a move towards $250–$320. Wait for clean confirmation before entering and manage risk wisely.
AAVE Update🚨📊 AAVE Update
AAVE has formed a double bottom pattern,
which is normally a strong bullish reversal signal —
but we still have a red resistance zone 🔴
sitting right above the price.
This red zone is acting as a strong ceiling,
and price must break above it
for the double bottom to fully confirm and momentum to continue higher.
Until that breakout happens,
upside stays limited and sellers remain active at this zone.

AAVEUSDT
"From my perspective, AAVE has a chance to return to daily support (blue box). That is just my forecast; the market is dynamic, of course."

clean higher-low structure after completing a deep corrective waPrice is now consolidating right below a key breakout zone, showing strength with a series of bullish candles and stable volume. If this consolidation holds, a continuation toward the next major resistance becomes highly probable. The stop-loss is placed below the recent demand zone to protect against a failed breakout. The setup targets a trend-extension move aligned with the broader bullish recovery structure.
AAVE price analysisAfter nearly 5–6 months of waiting, CRYPTOCAP:AAVE has reached the $146 target, followed by a constructive rebound. The brief volatility spike on October 10–11 doesn’t change the broader structure.
From a fundamental perspective, CRYPTOCAP:AAVE remains one of the more robust DeFi assets. Price stability is notable considering the complete absence of ETF-related hype — which means any future catalyst could amplify the move.
If market conditions improve, OKX:AAVEUSDT has a reasonable probability of retesting the $500–600 ATH zone.
What’s your view: is CRYPTOCAP:AAVE preparing for a mid-term trend expansion or is the asset likely to stay in accumulation?
______________
◆ Follow us ❤️ for daily crypto insights & updates!
🚀 Don’t miss out on important market moves
🧠 DYOR | This is not financial advice, just thinking out loud
AAVE USDT LONG SIGNAL📢 Official Trade Signal – AAVE/USDT
📈 Position Type: LONG
💰 Entry Price: 178.89
---
🎯 Take-Profit Targets (Tiered Exits):
• TP1: 183.90
• TP2: 188.75
• TP3: 194.53
• TP4: 199.73
• TP5: 205.80
• TP6: —
---
🛑 Stop-Loss: 173.00
📊 Timeframe: 15m
⚖️ Risk/Reward Ratio: 4.73
💥 Suggested Leverage: 5× – 10×
---
🧠 Technical Analysis Summary
AAVE is showing strong bullish continuation from the 177–179 demand zone, with higher-low structure confirming upward momentum on the 15m timeframe.
Order-flow and intraday momentum both align with a push toward upper resistance clusters:
183.90 → 188.75 → 194.53 → 199.73 → 205.80
A clean break above TP1 increases the probability of reaching extended targets.
---
⚙️ Trade Management Guidelines
✔ Take partial profits at TP1
✔ Move SL to Break-Even after TP1 hits
✔ Trail your SL as price moves toward higher targets
✔ Do NOT re-enter if SL is hit
✔ Confirm price structure before entering the trade
---
📌 TradingView Hashtags
#AAVEUSDT #AAVE #CryptoSignal #LongSetup
#TradingView #FuturesTrading #Altcoins #TechnicalAnalysis
---

AAVE USDT SHORT SIGNAL---
📢 Official Trade Signal – AAVE/USDT
📉 Position Type: SHORT
💰 Entry Price: 176.48
---
🎯 Take-Profit Targets (Partial Exits):
TP1 = 171.35
TP2 = 166.41
TP3 = 160.45
TP4 = —
TP5 = —
TP6 = —
---
🛑 Stop-Loss: 181.30
📊 Timeframe: 15m
⚖️ Risk/Reward Ratio: 3.65
💥 Suggested Leverage: 5× – 10×
---
🧠 Technical Analysis Summary
AAVE is showing clear bearish rejection from the 177–178 supply zone, with strong downside momentum forming on the 15m chart.
Price has swept local liquidity and is now forming a lower-high structure — a typical continuation signal for short setups.
Downside liquidity levels align precisely with our TP targets:
171.35 → 166.41 → 160.45
A confirmed break below 171.35 (TP1) opens the path toward deeper sell-side liquidity zones.
---
⚙️ Trade Management Rules
✔️ Take partial profit at TP1
✔️ Move SL to Break-Even immediately after TP1 hits
✔️ Trail SL as price approaches lower targets
✔️ Avoid forced re-entries if SL is hit
✔️ Confirm bearish structure before entering
---
⚠️ Risk-Management Note
Once TP1 is hit → move SL to Break-Even.
If the market reverses and stops you at BE afterward, the trade remains risk-free.
Protecting capital always comes first.
---
📌 TradingView Hashtags
#AAVEUSDT #AAVE #CryptoSignal #ShortSetup
#TradingView #FuturesTrading #Altcoins #TechnicalAnalysis
-

AAVE USDT LONG SIGNAL---
📢 Official Trade Signal – AAVE/USDT
📈 Position Type: LONG
💰 Entry Price: 183.25
---
🎯 Take-Profit Targets (Partial Exits):
TP1 = 190.95
TP2 = 202.39
TP3 = 214.00
TP4 = 225.00
TP5 = —
TP6 = —
---
🛑 Stop-Loss: 175.15
📊 Timeframe: 15m
⚖️ Risk/Reward Ratio: 5.32
💥 Suggested Leverage: 5× – 10×
---
🧠 Technical Analysis Summary
AAVE is showing strong bullish continuation after defending the 182–184 demand zone, forming a clean higher-low structure on lower timeframes.
Momentum indicators are turning upward, and price is attempting to reclaim short-term liquidity pockets.
Key upside liquidity pools align with the take-profit levels at 190.95, 202.39, 214, and 225.
A confirmed breakout above TP1 could trigger accelerated momentum toward the mid-range resistance zones.
---
⚙️ Trade Management Rules
✔️ Secure partial profits at TP1
✔️ Move SL to Break-Even after TP1 hits
✔️ Trail SL as price approaches higher targets
✔️ No re-entry if SL is hit
✔️ Always confirm trend structure before entering
---
⚠️ Risk-Management Note
Reaching TP1 → SL moves to BE (zero-risk position).
If price later returns and closes at BE, it is not a loss — it is optimal capital protection.
Capital preservation always comes first.
---
📌 TradingView Hashtags
#AAVEUSDT #AAVE #CryptoSignal #LongSetup
#TradingView #TechnicalAnalysis #FuturesTrading #Altcoins
---

AAVE Retracement Long Entry ZoneStructure broken. Looking for a Fibo retracement to enter Long. Target Levels are supply POI on the chart.

AAVE USDT SHORT SIGNAL📢 Official Trade Signal – AAVE/USDT
📉 Position Type: SHORT
💰 Entry Price: 163.47
---
🎯 Take-Profit Targets (Partial Exits):
TP1 = 161.08
TP2 = 158.17
TP3 = 155.16
TP4 = 152.82
TP5 = —
---
🛑 Stop-Loss: 166.00
📊 Timeframe: 15m
⚖️ Risk/Reward Ratio: 4.30
💥 Suggested Leverage: 5× – 10×
---
🧠 Technical Context
AAVE is showing weakness near the 163–166 supply zone, with clear bearish reaction and momentum fading.
Downside liquidity levels align with the TP zones, making this a high-probability corrective short setup.
---
⚙️ Trade Management Rules
✔️ Take partial profit at TP1
✔️ Move SL to Break-Even once TP1 is hit
✔️ Trail SL as price approaches each next target
✔️ Do not re-enter if SL at 166 is hit
✔️ Confirm short-term market structure before entering
---
⚠️ Risk-Management Note
Moving SL to Break-Even after TP1 is hit is standard professional risk protection.
If price reverses and stops you out at BE, this is not a losing trade — capital remains safe.
---
📌 TradingView Hashtags
#AAVEUSDT #AAVE #CryptoSignal #ShortSetup #TechnicalAnalysis
#TradingView #FuturesTrading #Altcoins

AAVE USDT SHORT SIGNAL---
📢 Official Trade Signal – AAVE/USDT
📉 Position Type: SHORT
💰 Entry Price: 157.70
---
🎯 Take-Profit Targets (Partial Exits)
TP1 = 154.78
TP2 = 151.49
TP3 = 148.46
TP4 = 144.97
TP5 = 141.09
TP6 = 136.21
---
🛑 Stop-Loss: 160.93
📊 Timeframe: —
⚖️ Risk/Reward Ratio: 6.78
💥 Suggested Leverage: 5× – 10×
---
🧠 Technical Analysis Summary
AAVE has reached a strong supply zone around 157–160, where sellers previously showed significant control.
Multiple bearish rejections and weakening momentum indicate a potential downside move.
The short setup aligns with a breakdown of minor support levels and a shift in market structure on lower timeframes.
Targets are placed at key liquidity pools and untested demand zones.
Price shows exhaustion signs with bearish divergence forming, supporting continuation to the downside.
---
⚙️ Trade Management Rules
Take partial profit at TP1
Move Stop-Loss to Break-Even once TP1 is hit
Trail SL progressively as price approaches TP2–TP6
Avoid re-entry if price hits SL at 160.93
---
⚠️ Important Risk-Management Note
✔️ After TP1 is reached, move SL to the Entry Price.
This is standard professional risk management.
❗ If price hits TP1 then reverses and stops out at break-even — this is NOT a losing trade.
It simply means the trade closed with zero risk.
🔐 Protecting capital always comes before chasing big profits.
---
📌 TradingView Hashtags
#AAVEUSDT #AAVE #CryptoSignal #ShortSetup #TechnicalAnalysis #TradingView #FuturesTrading #Altcoins
--
