ACT BREAKING OUTFortune AI Quant has detected upcoming potential in ACT, with technicals looking bullish here.
Two whales loaded up Dec 18–21 as AI narrative heats up again, ACT’s Solana infra for collaborative agents sets it up as a solid mid-cap play. 2026 brings FigmentTrade for autonomous AI trading + a decent

ACT/USDT — End of the Downtrend or the Start of a New Rally?ACT is sitting at one of its most critical moments in months. After being trapped in a brutal multi-month downtrend, price is finally pushing into the main descending trendline, a level that has rejected every bullish attempt since late 2024.
If this wall breaks, the entire market structure for ACT

ACTUSDT 1D#ACT is moving inside a descending channel on the daily chart. Consider buying a small bag near the support levels at:
$0.0183
$0.0163
In case of a bounce, the short-term target is:
🎯 $0.0252
And in case of a breakout above the channel resistance, the potential targets are:
🎯 $0.0318
🎯 $0.0414
🎯

ACTUSDT UPDATE#ACT
UPDATE
ACT Technical Setup
Pattern: Bullish Falling Wedge Pattern
Current Price: $0.00542
Target Price: $0.00760
Target % Gain: 40.29%
NASDAQ:ACT is breaking out of a falling wedge pattern on the 1D timeframe. Current price is $0.00542 with a target near $0.00760, showing about 40% potent

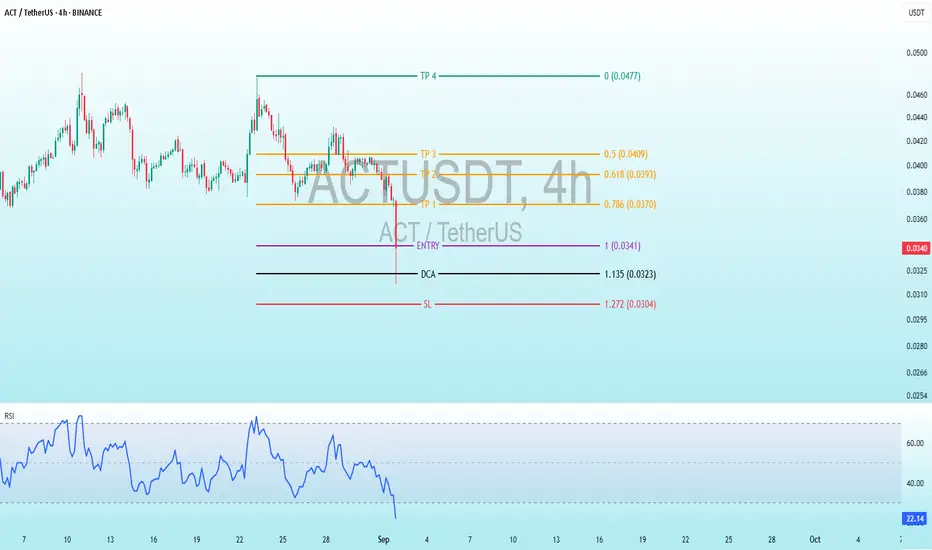
$ACT Ignite the Comeback! Thrilling 4-Hour Trading SetupBINANCE:ACTUSDT
NASDAQ:ACT Ignite the Comeback! Thrilling 4-Hour Trading Setup
Price Action Description
Historical Trend: The price began around 0.04-0.05 USDT in mid-August, with a gradual decline punctuated by choppy movements. A sharp drop occurred in early September, pushing it toward the
ACTUSDT Forming Bullish PennantACTUSDT is showing a bullish pennant pattern on the charts, which is typically considered a continuation signal of upward momentum. After a strong upward move, the price is now consolidating within a tight range, forming a pennant structure. This kind of setup often precedes another breakout to the
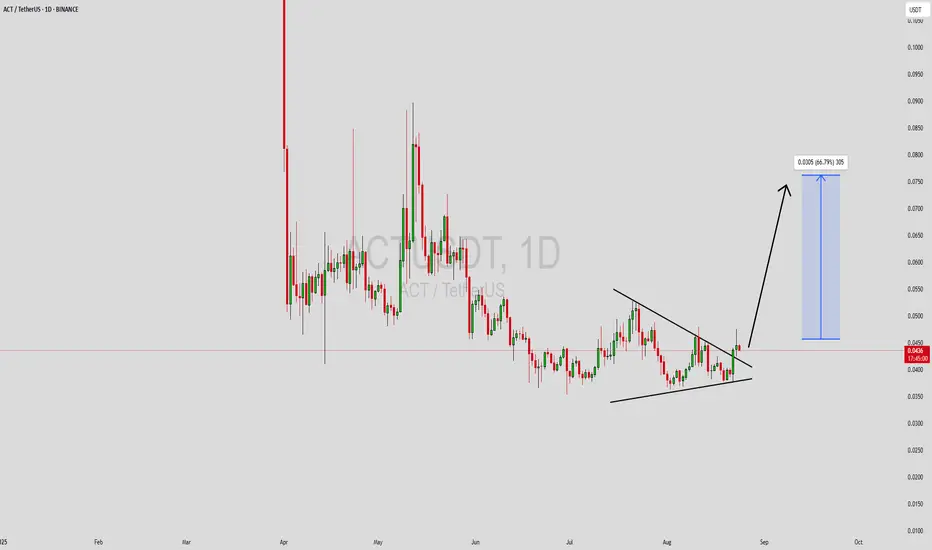
ACT/USDT - Mega pump 400%Huge pump loading! After a massive run, ACT has swept liquidity and been consolidating for over 130 days. Whales are loading up, supply is drying, and the breakout pressure is building. Once this range cracks, expect fireworks and a run straight for new highs. Next leg incoming!

$act Impulse wave starting after ABC correction -
🧠 Idea Description:
After a clear (A)-(B)-(C) corrective structure, price formed a solid bottom at 0.0354. Since then, the market entered a consolidation range and has now broken out to the upside.
According to Elliott Wave Theory, this breakout likely marks the beginning of an impulsive move. W

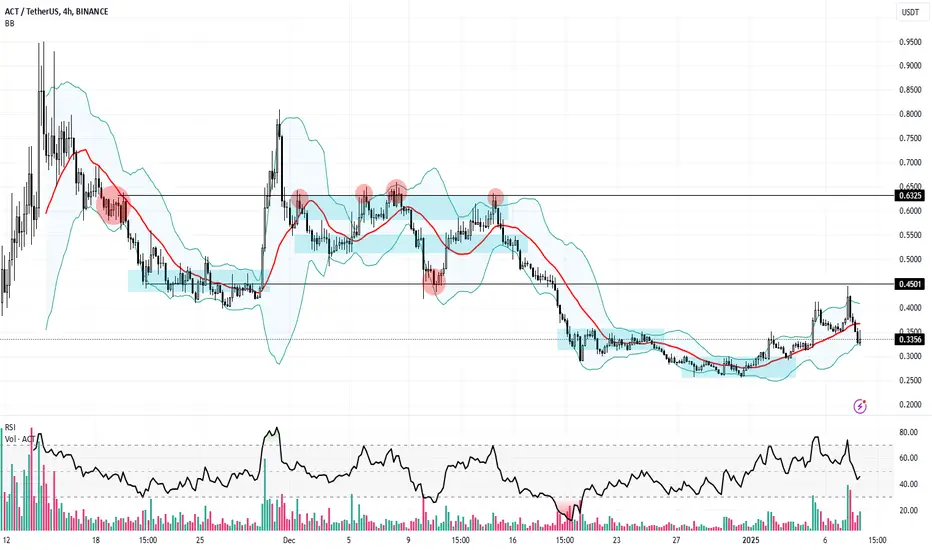
The market is challenging for newbies, but $ACT keep strongThe buy zone, which is between 0.32-0.33, has been reached by BINANCE:ACTUSDT , although this area must be watched.
As the selling force is lessened, the chart builds up and the purchasing volume resurfaces before continuing to move into the line.
ACTUSDT Forming Classic Falling Wedge ACTUSDT is currently exhibiting a classic falling wedge pattern on the chart—a bullish reversal setup known for its high probability of a breakout to the upside. After a consistent downtrend, the price action has started to compress within converging trendlines, suggesting that selling pressure is d

See all ideas
Summarizing what the indicators are suggesting.
Oscillators
Neutral
SellBuy
Strong sellStrong buy
Strong sellSellNeutralBuyStrong buy
Oscillators
Neutral
SellBuy
Strong sellStrong buy
Strong sellSellNeutralBuyStrong buy
Summary
Neutral
SellBuy
Strong sellStrong buy
Strong sellSellNeutralBuyStrong buy
Summary
Neutral
SellBuy
Strong sellStrong buy
Strong sellSellNeutralBuyStrong buy
Summary
Neutral
SellBuy
Strong sellStrong buy
Strong sellSellNeutralBuyStrong buy
Moving Averages
Neutral
SellBuy
Strong sellStrong buy
Strong sellSellNeutralBuyStrong buy
Moving Averages
Neutral
SellBuy
Strong sellStrong buy
Strong sellSellNeutralBuyStrong buy
Displays a symbol's price movements over previous years to identify recurring trends.