ADA: Cardano Near Breakout: H&S Reversal Pattern in PlayADA: Cardano Near Breakout: H&S Reversal Pattern in Play
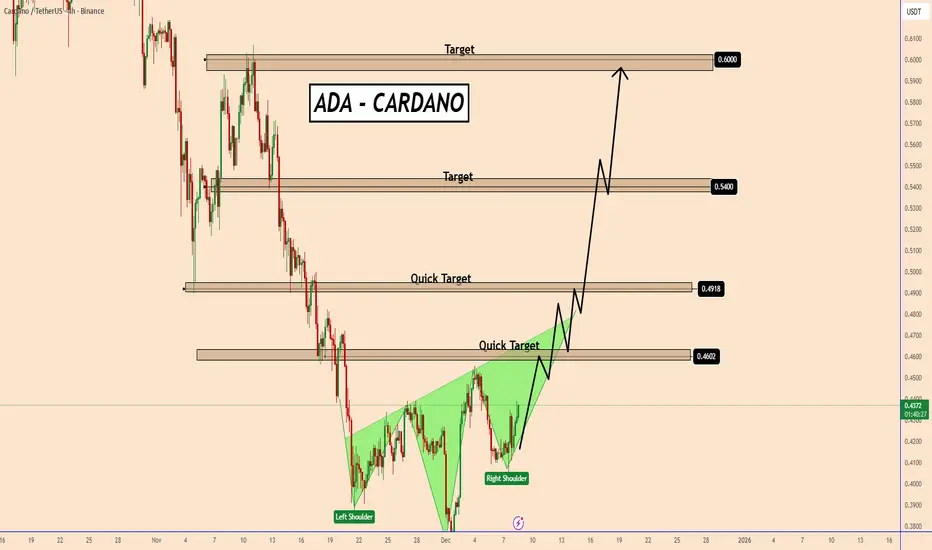
ADA is about to complete and reverse the Head and Shoulders pattern. The price is currently rising to test the neckline of the pattern, which is also the strongest area for buyers.
Once this area is broken, we can see ADA rising in a clear
ADA/USDT | Cardano Pulls Back After the Rally! What's Next?CRYPTOCAP:ADA pushed all the way to $0.485 before getting hit with a sharp correction and right now price is trading near $0.40 which is roughly a sixteen percent drop from the recent high. Nothing major has changed in the broader structure because the key zone has always been the $0.32 to $0.36 de

ADAUSDT: Bullish Push to 0.45?BINANCE:ADAUSDT is eyeing a bullish rebound on the 4-hour chart , with price forming higher lows after touching the downward trendline and cumulative long liquidation zone, converging with a potential entry area that could ignite upside momentum if buyers defend against short-term dips. This s

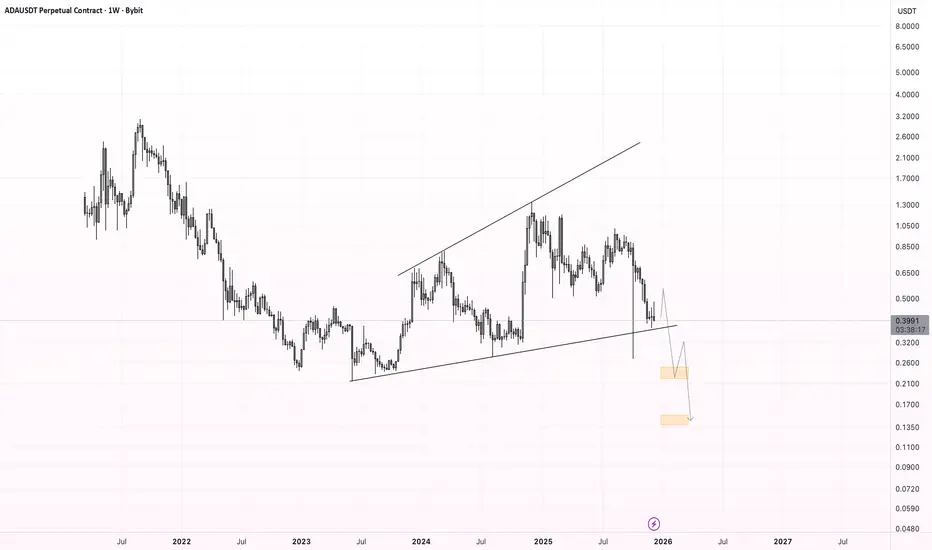
ADA - Bearish Expanding TrianglePrice is trading within a broadening (expanding) triangle , with higher highs and lower lows indicating increasing volatility and distribution. The structure favors a bearish resolution , and I’m expecting a breakdown below the lower trendline to confirm continuation to the downside.
Expectati
ADAUSDT the 0.6$ soon will hit againAs observed on the chart, ADA has executed a decisive breakout above a major resistance zone, confirmed by a strong bullish candle accompanied by significantly high trading volume. This combination of price action and volume indicates substantial buying pressure and validates the breakout's strength

ADAUSDT —Breakout: 0.4355–0.4150 Will Decide the Next Trend?ADA is approaching a critical phase after successfully breaking above a major descending trendline that has guided the market lower for weeks. This breakout signals a potential shift in momentum, but the bullish move is not confirmed yet. Everything now depends on how price reacts to the 0.4355–0.41

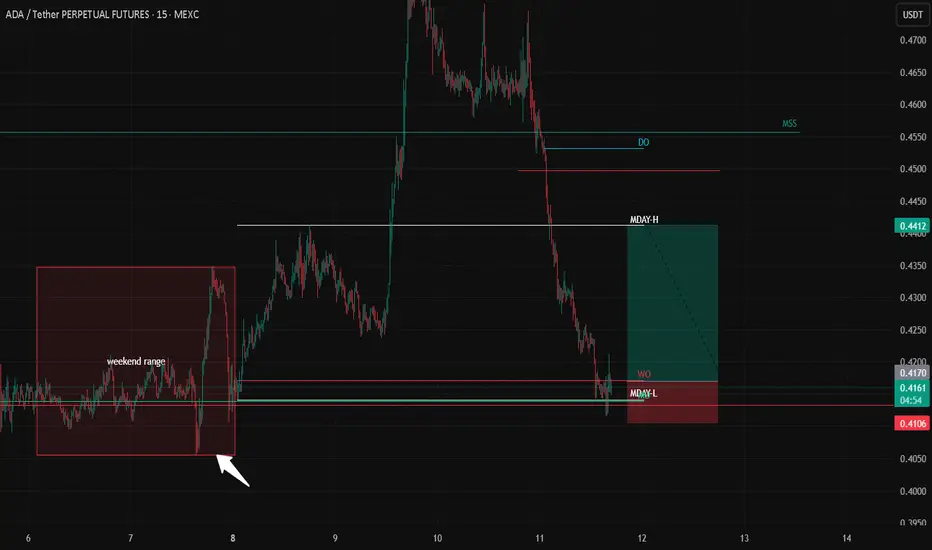
ADA Scalp long ideaScalp long setup
Taking a quick long based on a 5m MSS on Total Market Cap, showing a short-term momentum shift. Price also printed a clean V-shape recovery on the 5m, suggesting downside exhaustion and potential for a retrace toward intraday levels.
Risk-to-reward remains strong, with clear invalid
ADAUSDT 12H#ADA has broken above the descending resistance and the SMA50 on the 12H timeframe chart. In case of a breakout above the Ichimoku cloud, the potential targets are:
🎯 $0.5414
🎯 $0.5941
🎯 $0.6468
🎯 $0.7219
🎯 $0.8175
⚠️ Always remember to use a tight stop-loss and maintain proper risk management.

ADA Breaks the Downtrend, Momentum Is ShiftingADA is showing its first meaningful strength after weeks of downward pressure. Price has broken above the multi week descending trendline that has been acting as consistent resistance throughout the entire downtrend. This breakout indicates a potential shift in momentum, especially as the daily cand

Cardano (ADA): Trendline Breakout vs. The "Golden" Buy Zone 🚀 Cardano (ADA): Trendline Breakout vs. The "Golden" Buy Zone
Cardano ( CRYPTOCAP:ADA ) is currently compressing under a **major descending trendline**, squeezing price action into a pivotal decision point. As we approach the end of 2025, the market structure is revealing two distinct scenarios fo

See all ideas
Summarizing what the indicators are suggesting.
Oscillators
Neutral
SellBuy
Strong sellStrong buy
Strong sellSellNeutralBuyStrong buy
Oscillators
Neutral
SellBuy
Strong sellStrong buy
Strong sellSellNeutralBuyStrong buy
Summary
Neutral
SellBuy
Strong sellStrong buy
Strong sellSellNeutralBuyStrong buy
Summary
Neutral
SellBuy
Strong sellStrong buy
Strong sellSellNeutralBuyStrong buy
Summary
Neutral
SellBuy
Strong sellStrong buy
Strong sellSellNeutralBuyStrong buy
Moving Averages
Neutral
SellBuy
Strong sellStrong buy
Strong sellSellNeutralBuyStrong buy
Moving Averages
Neutral
SellBuy
Strong sellStrong buy
Strong sellSellNeutralBuyStrong buy
Displays a symbol's price movements over previous years to identify recurring trends.