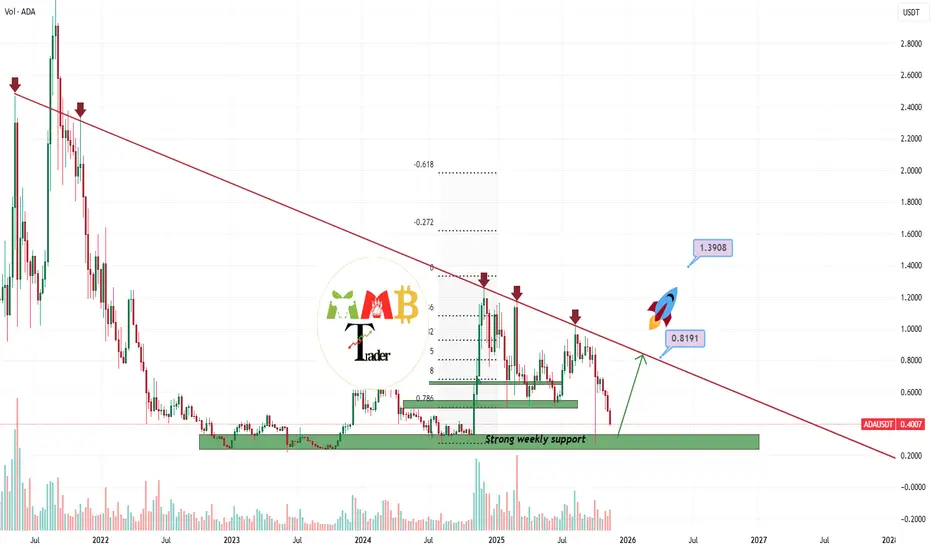
ADAUSDT first target to hit is now +100% (0.80$)ADAUSDT is currently trading within a bearish market structure, experiencing significant downward pressure. However, it's crucial to note that the asset is approaching a major weekly support level. From a technical perspective, the current price zone around $0.40 could present a potential accumulati
Related pairs

ADA/USDT | Cardano Slides to 0.38 and Bears Keep Pushing!By analyzing the CRYPTOCAP:ADA chart on the 3 day timeframe, we can see that price finally dropped to 0.38, which confirms the bearish pressure we talked about earlier. ADA is now trading near 0.40 and the chart still looks weak. Buyers are not showing real strength and momentum is clearly on the

ADA - BUY SETUP (NOV 2025)ADA - BUY SETUP (NOV 2025)
ADA is currently at strong support, making it a solid long-term investment. Hold onto it as it has the potential to reach $3.

LongAccording to the analysis of the waves and the help of the Gann method, it can be expected that the price will return to the green zone again.
This is my personal opinion. Please don't use it as your trading criteria. Good luck

Cardano (ADA) – Weekly Technical Analysis
ADA has been moving inside a large Symmetrical Triangle since the 2021 peak — a long-term consolidation pattern that typically leads to a strong breakout once price compression reaches its end.
When observing the major support line of the triangle, the price has shown a clear repetitive behavior:

ADA USDT LONG SIGNAL---
📢 Official Trade Signal – ADA/USDT
📈 Position Type: LONG
💰 Entry Price: 0.4134
---
🎯 Take-Profit Targets (Partial Exits):
TP1 = 0.4230
TP2 = 0.4305
TP3 = 0.4370
TP4 = 0.4445
TP5 = —
---
🛑 Stop-Loss: 0.4045
📊 Timeframe: 15m
⚖️ Risk/Reward Ratio: 3.55
💥 Suggested Leverage: 5× – 10×
---

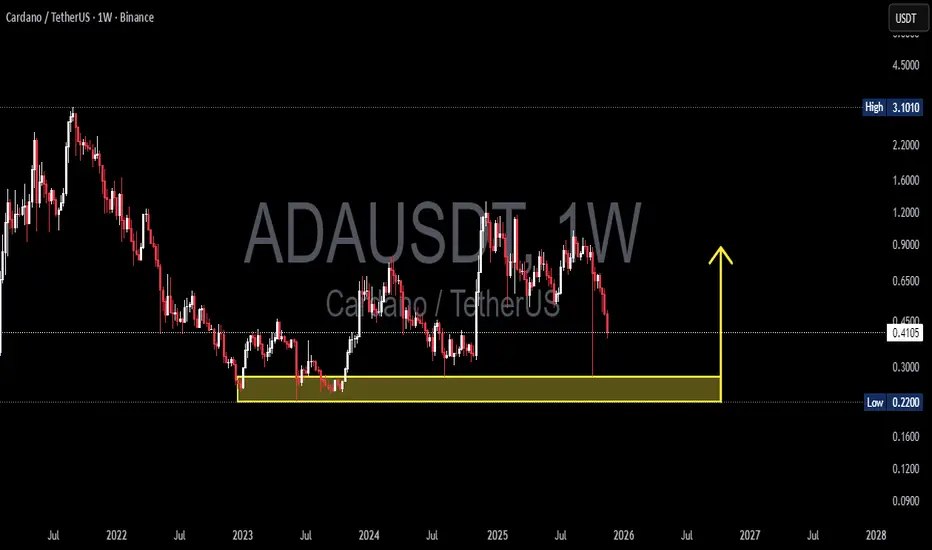
ADA/USDT — Major Reversal or Deep Breakdown?ADA/USDT on the weekly timeframe has returned to one of the most decisive zones since 2022.
The 0.275–0.22 region is not just another support — it is a historical demand and accumulation block where major reversals have repeatedly formed.
This week, ADA once again tapped this zone with a long downs

ADA USDT LONG SIGNAL---
📢 Trade Signal: ADA/USDT
📈 Position Type: Long
💰 Entry Price: 0.4630
---
🎯 Take-Profit Targets (Partial Exits)
TP1: 0.4710
TP2: 0.4765
TP3: 0.4835
TP4: —
TP5: —
TP6: —
---
0.4550
🛑 Stop-Loss: 0.4625
⚖️ Risk/Reward Ratio: 3.91
💥 Suggested Leverage: 5× – 10×
⏱ Timeframe: —
---
🧠 Te

See all ideas
Summarizing what the indicators are suggesting.
Oscillators
Neutral
SellBuy
Strong sellStrong buy
Strong sellSellNeutralBuyStrong buy
Oscillators
Neutral
SellBuy
Strong sellStrong buy
Strong sellSellNeutralBuyStrong buy
Summary
Neutral
SellBuy
Strong sellStrong buy
Strong sellSellNeutralBuyStrong buy
Summary
Neutral
SellBuy
Strong sellStrong buy
Strong sellSellNeutralBuyStrong buy
Summary
Neutral
SellBuy
Strong sellStrong buy
Strong sellSellNeutralBuyStrong buy
Moving Averages
Neutral
SellBuy
Strong sellStrong buy
Strong sellSellNeutralBuyStrong buy
Moving Averages
Neutral
SellBuy
Strong sellStrong buy
Strong sellSellNeutralBuyStrong buy
Displays a symbol's price movements over previous years to identify recurring trends.
Frequently Asked Questions
The current price of ADA / UST (ADA) is 0.43042000 USDT — it has fallen −0.47% in the past 24 hours. Try placing this info into the context by checking out what coins are also gaining and losing at the moment and seeing ADA price chart.
ADA / UST price has fallen by −6.73% over the last week, its month performance shows a −34.96% decrease, and as for the last year, ADA / UST has decreased by −55.16%. See more dynamics on ADA price chart.
Keep track of coins' changes with our Crypto Coins Heatmap.
Keep track of coins' changes with our Crypto Coins Heatmap.
ADA / UST (ADA) reached its highest price on Sep 2, 2021 — it amounted to 3.09890000 USDT. Find more insights on the ADA price chart.
See the list of crypto gainers and choose what best fits your strategy.
See the list of crypto gainers and choose what best fits your strategy.
ADA / UST (ADA) reached the lowest price of 0.07578100 USDT on Sep 23, 2020. View more ADA / UST dynamics on the price chart.
See the list of crypto losers to find unexpected opportunities.
See the list of crypto losers to find unexpected opportunities.
The safest choice when buying ADA is to go to a well-known crypto exchange. Some of the popular names are Binance, Coinbase, Kraken. But you'll have to find a reliable broker and create an account first. You can trade ADA right from TradingView charts — just choose a broker and connect to your account.
Crypto markets are famous for their volatility, so one should study all the available stats before adding crypto assets to their portfolio. Very often it's technical analysis that comes in handy. We prepared technical ratings for ADA / UST (ADA): today its technical analysis shows the sell signal, and according to the 1 week rating ADA shows the sell signal. And you'd better dig deeper and study 1 month rating too — it's strong sell. Find inspiration in ADA / UST trading ideas and keep track of what's moving crypto markets with our crypto news feed.
ADA / UST (ADA) is just as reliable as any other crypto asset — this corner of the world market is highly volatile. Today, for instance, ADA / UST is estimated as 1.36% volatile. The only thing it means is that you must prepare and examine all available information before making a decision. And if you're not sure about ADA / UST, you can find more inspiration in our curated watchlists.
You can discuss ADA / UST (ADA) with other users in our public chats, Minds or in the comments to Ideas.