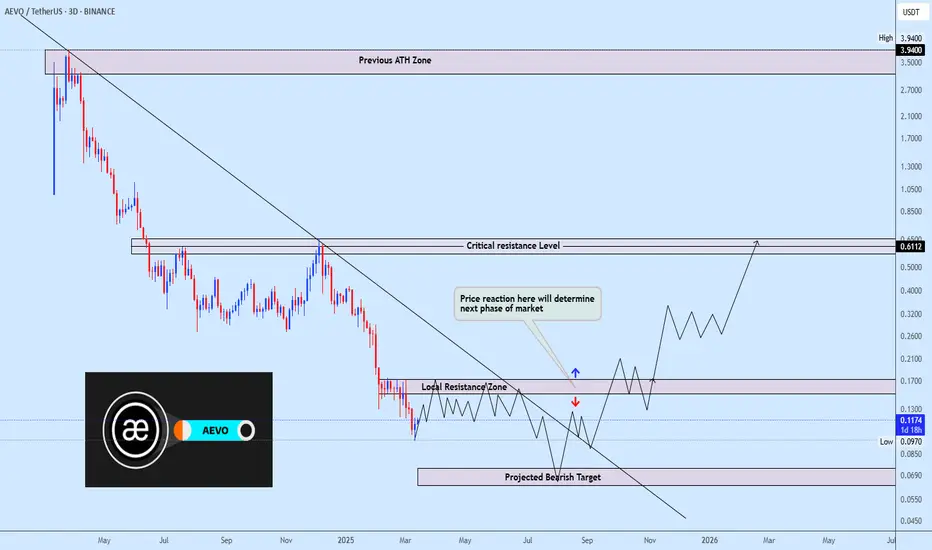
Aevousdt trading ideaAevo exhibit clear downtrend with a descending trendline acting as resistance. Price is currently reacting to a local resistance zone, where a breakout could lead to a test of the critical resistance at 0.6112, while rejection could send it towards the projected bearish target around 0.0580. Price a
AEVO/USDT — At Demand Zone: End of the Bearish Phase?📊 Technical Overview:
AEVO/USDT is showing signs of structural stabilization after a prolonged downtrend since early 2024.
The major descending trendline (yellow) that had been acting as dynamic resistance has now been broken to the upside, indicating early weakness in bearish momentum.
Currently, p
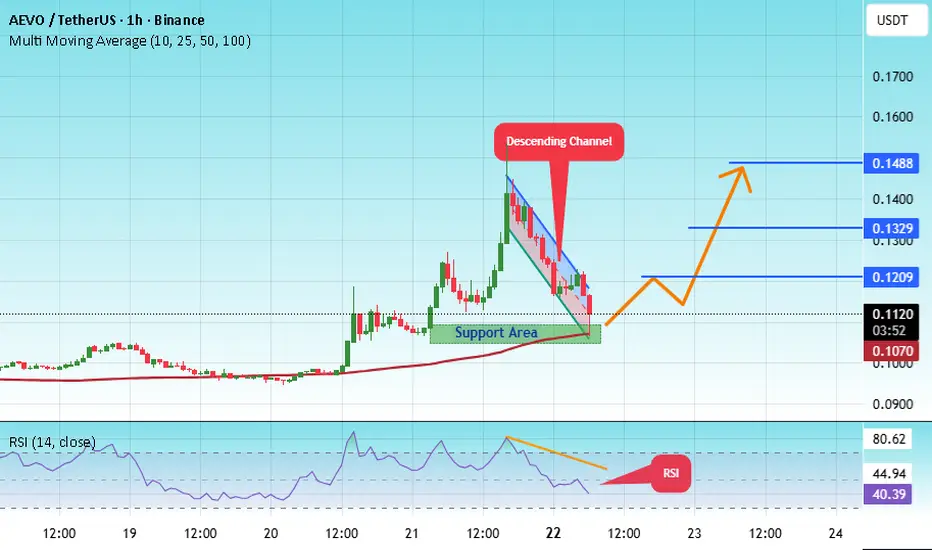
#AEVO/USDT — Accumulation at Key Zone: Breakout or Breakdown?#AEVO
The price is moving within a descending channel on the 1-hour frame, adhering well to it, and heading for a strong breakout and retest.
We have a bearish trend on the RSI indicator that is about to be broken and retested, which supports the upward breakout.
There is a major support area in
Bullish on $AEVO - perps supercyclePrice has rejected off the daily breaker wick
We have CISD in H4
We have perps platforms doing well on top of that AEVO offers options as well hence bullish
Long-term targets are up to 0.6 to 1 and maybe all time highs

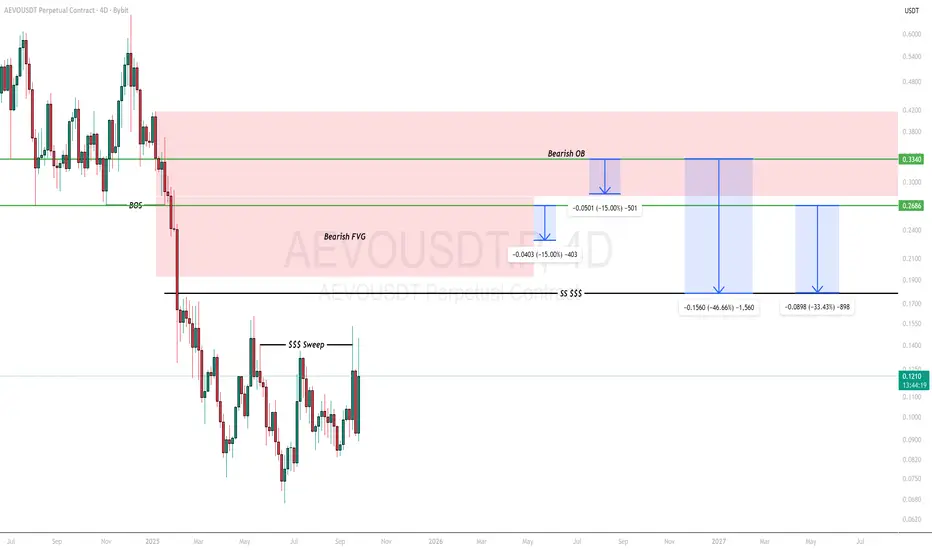
AEVOUSDT Trading Idea.Likely a reversal to the downside from $0.2686 or $0.3340 provided the two weeks order block is not mitigated.
The preferred position should be a short position.
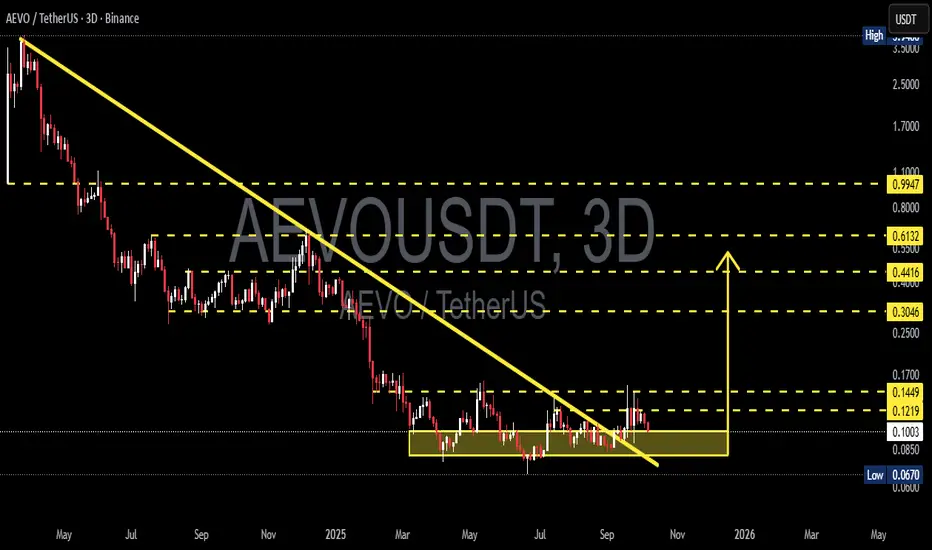
AEVO/USDT — A Classic Altcoin Bottom Structure🧠 Context:
Another chart showing a typical altcoin structure near the bottom. Price has dropped over 98% from the all-time high. The concept of a "bottom" here is highly abstract — risk remains elevated, and liquidity is thin.
📉 Chart Highlights:
▪️ Price is still moving within a descending channel

AEVO — 230 Days of Accumulation, Breakout AheadAEVO has been consolidating for the past 230 days in what looks like a Wyckoff accumulation between the 100M–150M market cap range. AEVO is now on the verge of breaking its long-term bear trend.
🟢 Long Setup Idea
Entry Zone: $0.13–$0.12
Stop-Loss: Below $0.11
Target: ~$0.35
Key Resistance

AEVOUSDT UPDATE#AEVO
UPDATE
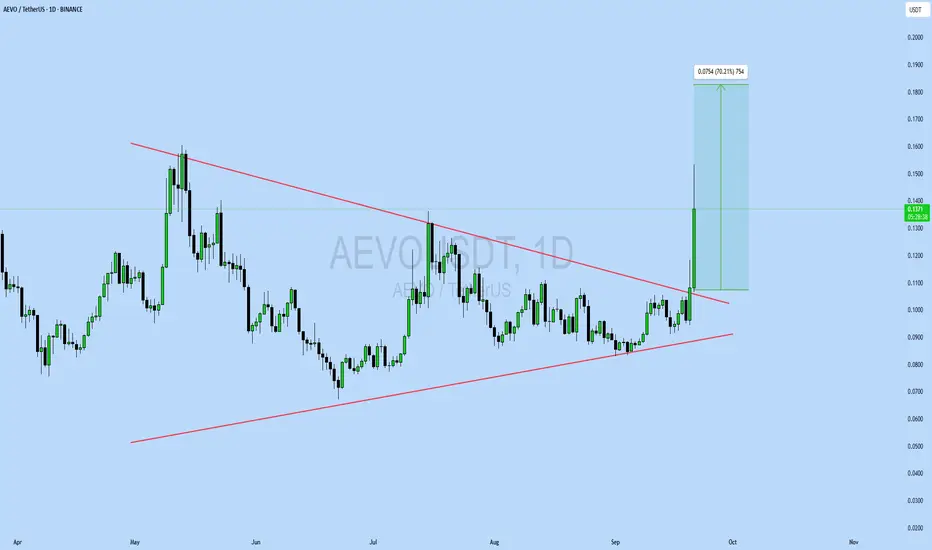
AEVO Technical Setup
Pattern: Bullish Pennant Pattern
Current Price: $0.1379
Target Price: $0.213
Target % Gain: 70.21%
ASX:AEVO has broken out of a Bullish Pennant on the 1D timeframe. Current price is $0.1379 with a target near $0.213, offering over 70% upside potential. The bre
AEVO/USDT Formed Diamond Pattern BottomAEVO has be consolidating sideways for nearly 200 Days and it is now breaking to the upside.
I am expecting a bullish retracement to Fib level 0.382.
If you like the ideas please don't forget to like and follow.
Thank you

AEVO/USDT — Accumulation at Key Zone: Breakout or Breakdown?📖 Full Analysis
Since its listing, AEVO has been in a heavy downtrend, consistently forming lower highs under the dominant descending trendline (yellow). However, for the past several months, the price has been holding in the same range: 0.067 – 0.12 (yellow box).
This zone is highly significant:

See all ideas
Summarizing what the indicators are suggesting.
Oscillators
Neutral
SellBuy
Strong sellStrong buy
Strong sellSellNeutralBuyStrong buy
Oscillators
Neutral
SellBuy
Strong sellStrong buy
Strong sellSellNeutralBuyStrong buy
Summary
Neutral
SellBuy
Strong sellStrong buy
Strong sellSellNeutralBuyStrong buy
Summary
Neutral
SellBuy
Strong sellStrong buy
Strong sellSellNeutralBuyStrong buy
Summary
Neutral
SellBuy
Strong sellStrong buy
Strong sellSellNeutralBuyStrong buy
Moving Averages
Neutral
SellBuy
Strong sellStrong buy
Strong sellSellNeutralBuyStrong buy
Moving Averages
Neutral
SellBuy
Strong sellStrong buy
Strong sellSellNeutralBuyStrong buy
Displays a symbol's price movements over previous years to identify recurring trends.