AINYSE:AI has been consolidating in a 250 day accumulation zone, building strong base structure. A breakout to the upside looks inevitable as the AI narrative regains momentum alongside altcoin season. Solid risk-reward setup here for those positioned early before the next wave.

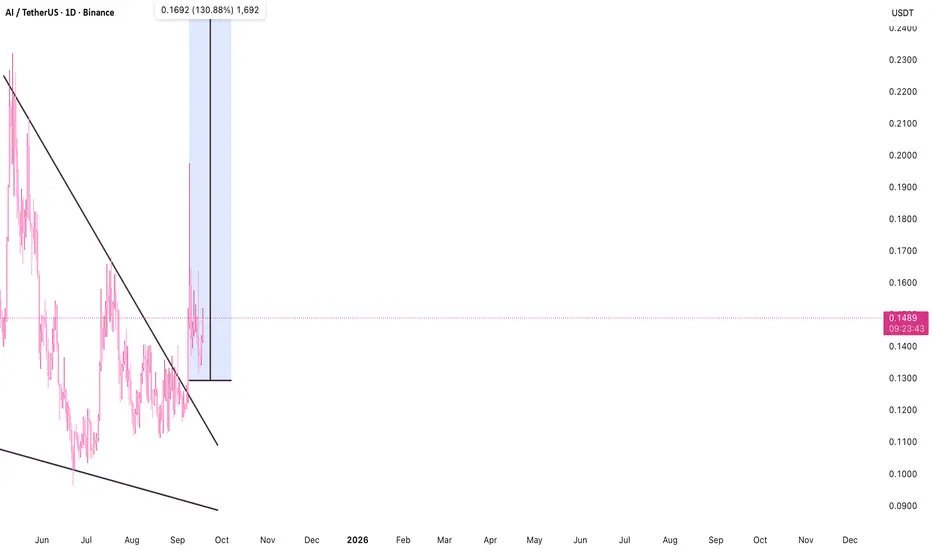
AIUSDT 1D#AI is moving inside a falling wedge pattern on the daily chart and has bounced off the wedge support line. In case of a breakout above the wedge resistance and the daily EMA100, the potential targets are:
🎯 $0.1299
🎯 $0.1654
🎯 $0.2210
🎯 $0.2659
🎯 $0.3107
🎯 $0.3747
🎯 $0.4561
⚠️ Always remember to

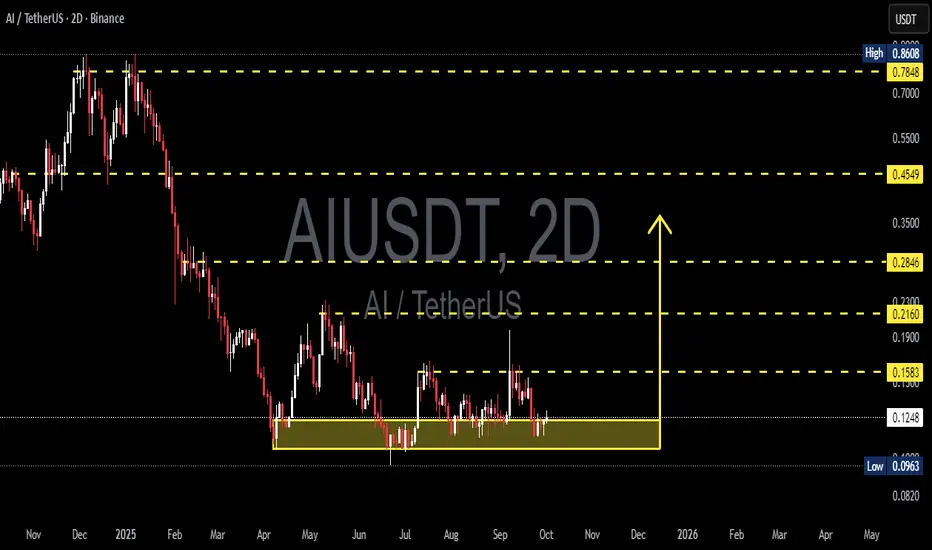
AIUSDT (2D) — Entering a Major Accumulation Phase?Overview:
AIUSDT is currently in a deep accumulation phase after a long decline from the peak at 0.8608. Price is consolidating within the critical support zone of 0.0963 – 0.1257 (highlighted in yellow). This level has been tested multiple times, showing strong interest from both buyers and sellers
Double Bottom!25-09-2025
Double bottom with Bullish Divergence.
Crossing the LH may lead it towards the mentioned target.

AIUSDT Formed Diamond Pattern BottomAI appears to end its sideways consolidation period and is ready to move up.
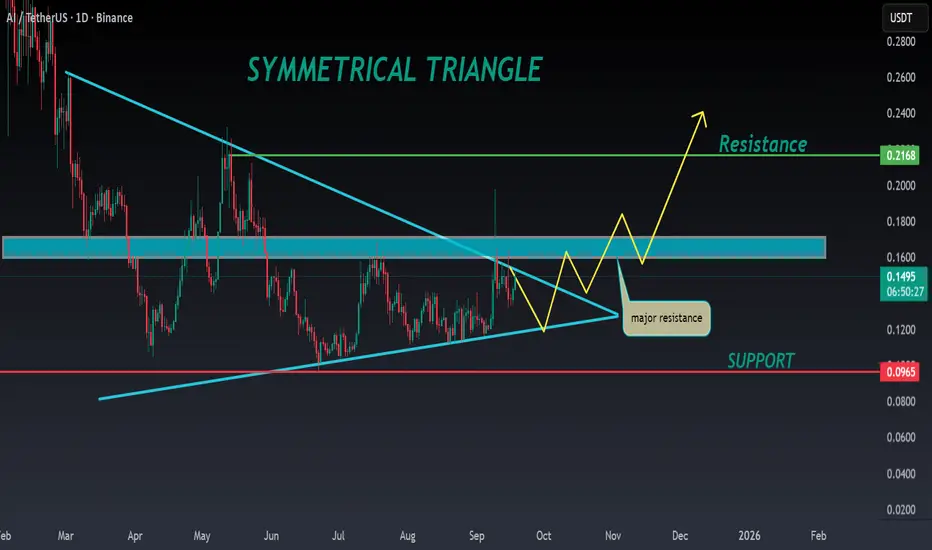
AI ANALYSIS🔮#AI Analysis 💰💰
#AI is trading in a symmetrical triangle in a weekly time frame and if it breakouts with high volume then we can see a bullish momentum in #AI. Before that we will see little bit bearish movement .
🔖 Current Price: $0.1490
⏳ Target Price: $0.2100
⁉️ What to do?
- We can trade
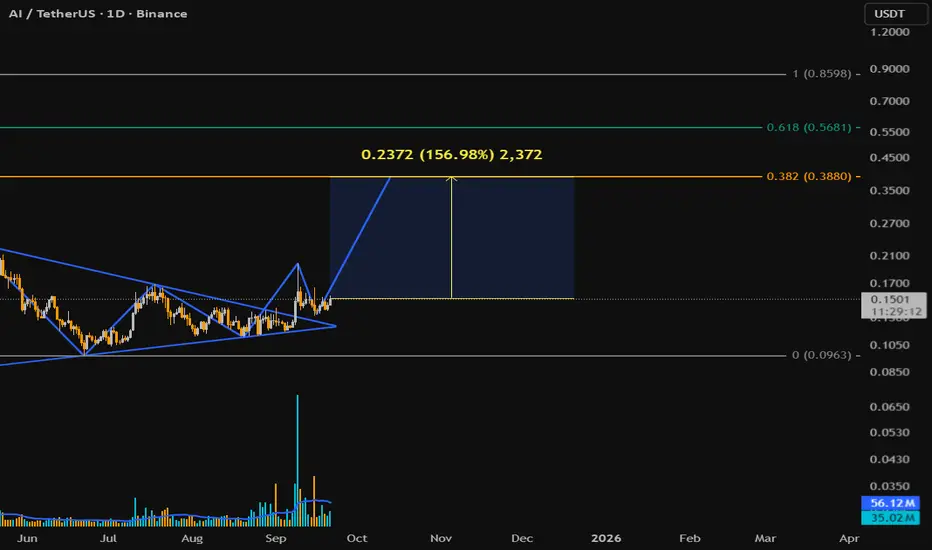
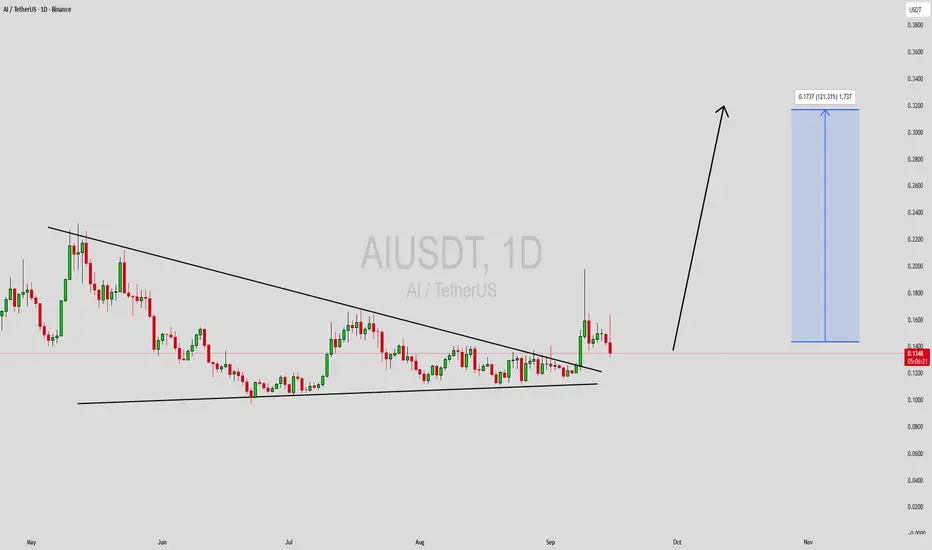
AI/USDT – Bullish Breakout: Falling Wedge Targets +130%AI has broken out of a multi-month falling wedge pattern, with confirmation from a strong daily candle closing above the descending trendline. Current price is 0.1501 USDT, showing renewed buying pressure post-breakout.
The measured move from the wedge projects a potential target near 0.30 USDT (+1
AIUSDT Forming Bullish PennantAIUSDT is currently forming a bullish pennant pattern, a continuation setup that typically signals the market is preparing for another strong upward move after an initial rally. This consolidation phase shows that buyers are holding control, with price coiling into a tighter range before a potential
AIUSDT – Consolidation at Demand Zone: Accumulation or Bearish?⏳ Current Market Context
AIUSDT is at a critical juncture, consolidating within the demand zone of $0.096 – $0.124 (yellow box). This zone has been repeatedly tested since June 2025, making it a last line of defense for buyers before a potential deeper drop.
While the macro structure remains bearis

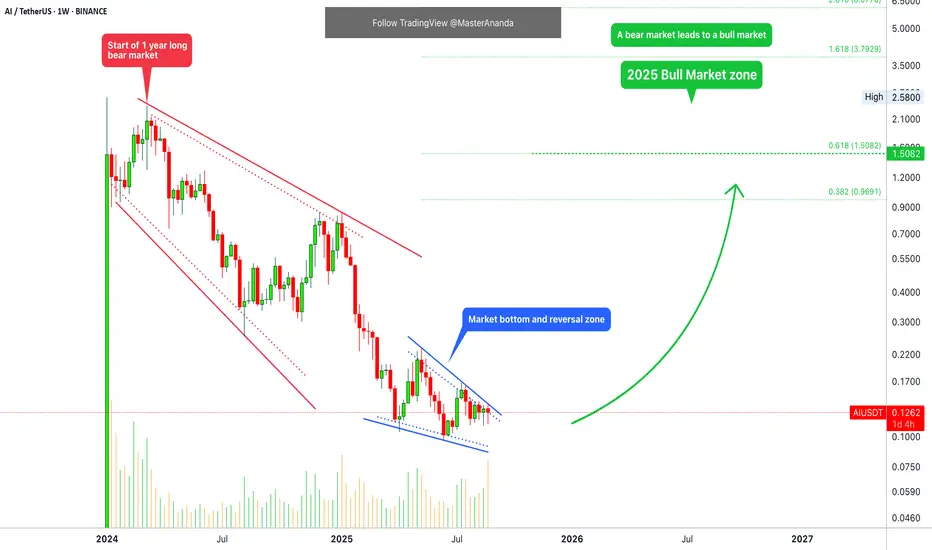
Sleepless AI · It is all in your mindSee here the chart for Sleepless AI (AIUSDT). This is long-term.
Notice the volume this week. Really high bearish volume and a red candle. Why isn't this considered a bearish signal? Because the wick low this week is higher compared to the main low in June and the previous low in April. It can also
See all ideas
Summarizing what the indicators are suggesting.
Oscillators
Neutral
SellBuy
Strong sellStrong buy
Strong sellSellNeutralBuyStrong buy
Oscillators
Neutral
SellBuy
Strong sellStrong buy
Strong sellSellNeutralBuyStrong buy
Summary
Neutral
SellBuy
Strong sellStrong buy
Strong sellSellNeutralBuyStrong buy
Summary
Neutral
SellBuy
Strong sellStrong buy
Strong sellSellNeutralBuyStrong buy
Summary
Neutral
SellBuy
Strong sellStrong buy
Strong sellSellNeutralBuyStrong buy
Moving Averages
Neutral
SellBuy
Strong sellStrong buy
Strong sellSellNeutralBuyStrong buy
Moving Averages
Neutral
SellBuy
Strong sellStrong buy
Strong sellSellNeutralBuyStrong buy
Displays a symbol's price movements over previous years to identify recurring trends.