
AIXB/USDT — Decision Zone: Reversal or Major Breakdown Ahead?
Main Summary:
AIXBT is currently standing at a critical juncture. After a strong rejection from the descending trendline, price has pulled back to retest the key demand zone at 0.0793–0.0690, which also aligns perfectly with the Fibonacci retracement 0.5–0.618 area — a golden pocket where buyers of

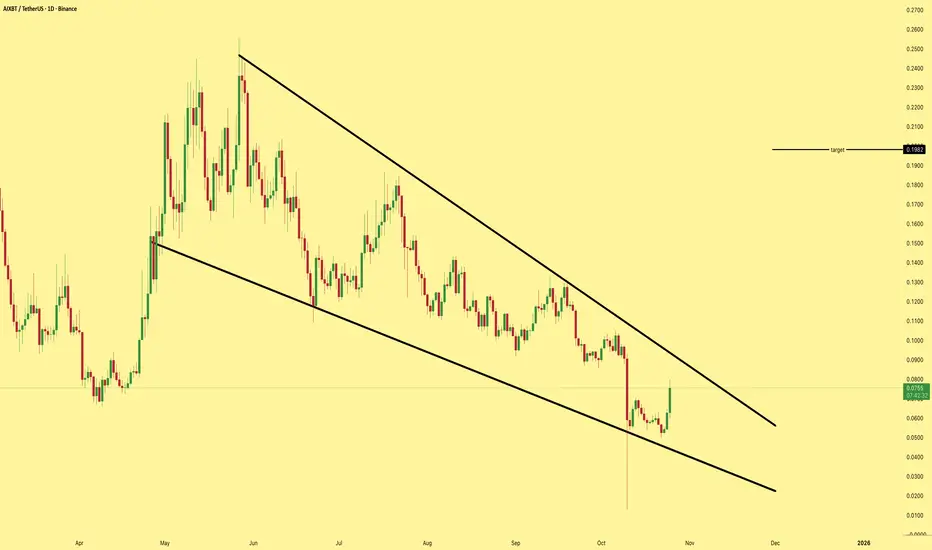
AIXBTUSDT 1D#AIXBT is moving inside a falling wedge pattern on the daily chart. Consider buying here and near the support levels at:
🔹 $0.0818
🔹 $0.0705
In case of a breakout above the wedge resistance, the potential targets are:
🎯 $0.1225
🎯 $0.1442
🎯 $0.1659
🎯 $0.1968
🎯 $0.2362
⚠️ Always remember to use a

AIXBT Approaching Breakout Zone$AIXBT/USDT has fully recovered from the recent crash and is now trading near a key resistance, a level that previously acted as strong support.
If the price manages to close above this zone, it could trigger a massive upside move. Definitely one to keep a close eye on.
DYOR, NFA

$AIXBT Gains Steam as AI Heats UpThe AI trading sector is heating up once again — and BINANCE:AIXBTUSDT is at the forefront of the rally. The token jumped over 38% today, driven by renewed excitement around AI agents and automated trading technologies.
The surge in $AIXBT has also sparked speculation that other AI tokens like VI

AIXBT$AIXBT looks bottomed out here, showing early signs of accumulation. If the AI and agent narratives pick up again, this could easily deliver a 150% move from a simple spot position. Strong narrative setup with solid upside potential once momentum returns.
AIXBT/USDT –Reversal Phase Ready to IAIXBT appears to have completed the final stage of its reversal cycle, executing a textbook liquidity sweep and stop-loss grab a move often seen before major trend reversals.
After cleaning out weak hands and triggering liquidity below key levels, price is now primed for a powerful upside move, su

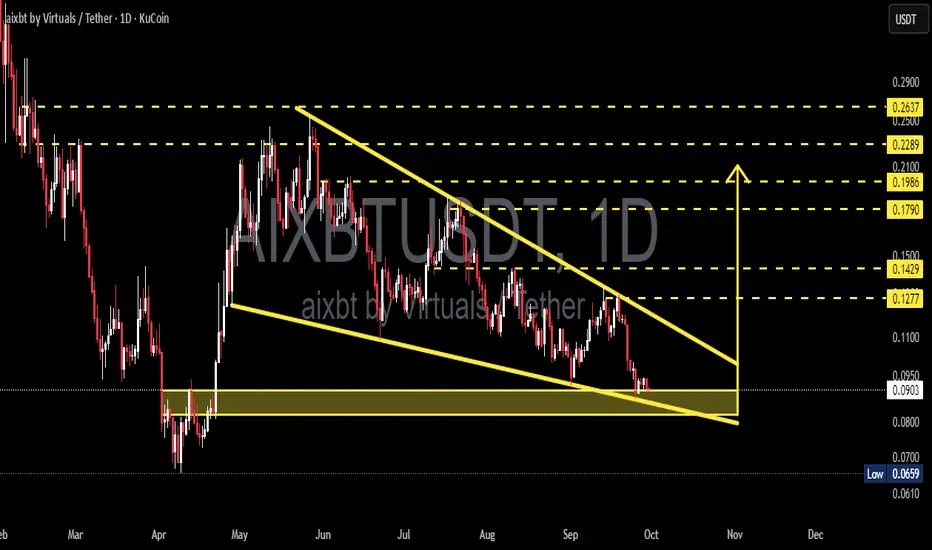
AIXBTUSDT — Falling Wedge at Demand Zone: Reversal or Breakdown?Analysis
AIXBT/USDT is currently trading within a Falling Wedge pattern on the daily timeframe, a classic setup that often signals a potential bullish reversal if confirmed by an upside breakout.
Right now, price is sitting exactly at the 0.08–0.09 demand zone, a key support area that has held mul
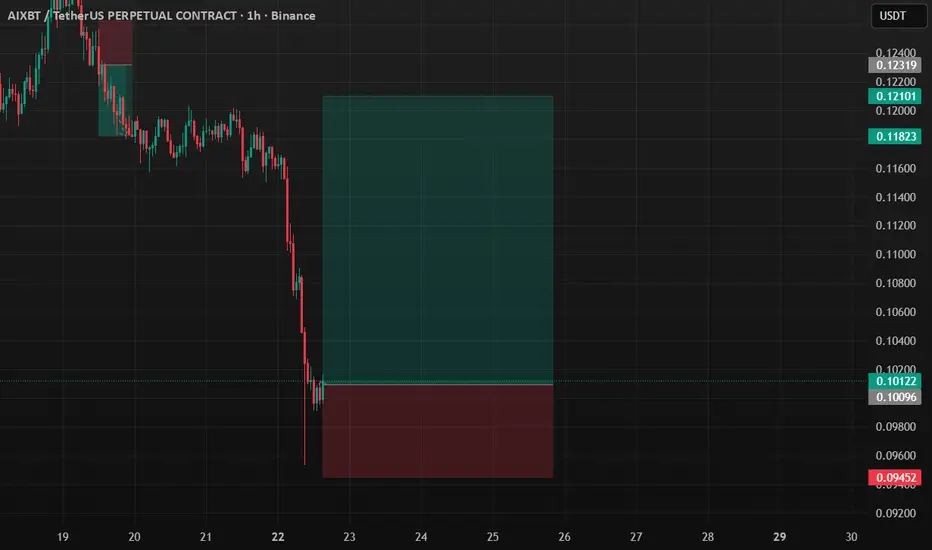
AIXBT Long SetupAlways manage your own risks this is not a investment advise I am not responsible neither your loss nor profit.
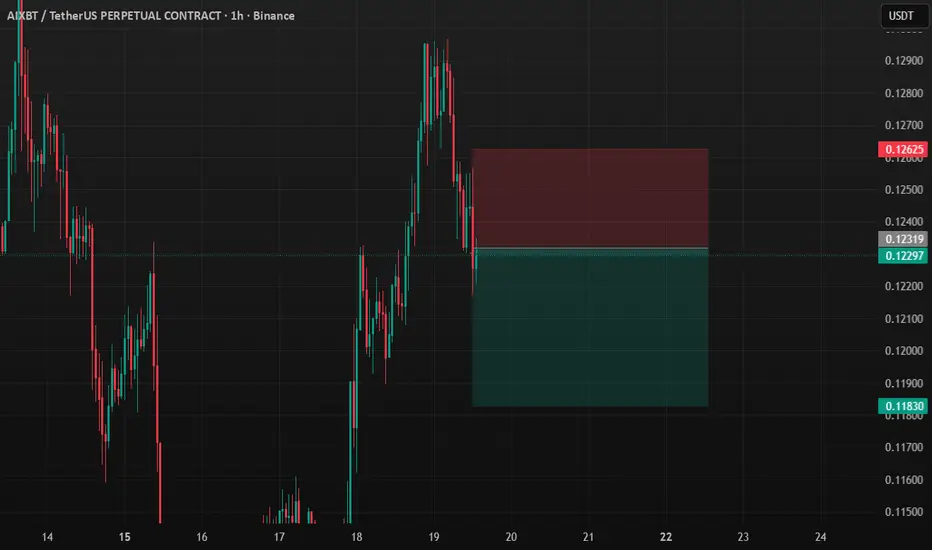
AIXBT Short Setupit is not detailed analys just a position take it or not I am not gonna explain it
Always manage your own risks this is not a investment advise I am not responsible neither your loss nor profit.
See all ideas
Summarizing what the indicators are suggesting.
Oscillators
Neutral
SellBuy
Strong sellStrong buy
Strong sellSellNeutralBuyStrong buy
Oscillators
Neutral
SellBuy
Strong sellStrong buy
Strong sellSellNeutralBuyStrong buy
Summary
Neutral
SellBuy
Strong sellStrong buy
Strong sellSellNeutralBuyStrong buy
Summary
Neutral
SellBuy
Strong sellStrong buy
Strong sellSellNeutralBuyStrong buy
Summary
Neutral
SellBuy
Strong sellStrong buy
Strong sellSellNeutralBuyStrong buy
Moving Averages
Neutral
SellBuy
Strong sellStrong buy
Strong sellSellNeutralBuyStrong buy
Moving Averages
Neutral
SellBuy
Strong sellStrong buy
Strong sellSellNeutralBuyStrong buy
Displays a symbol's price movements over previous years to identify recurring trends.