#ALICE/USDT – Potential Trend Reversal After Long Accumulation#ALICE
The price is moving within an ascending channel on the 1-hour timeframe and is adhering to it well. It is poised to break out strongly and retest the channel.
We have a downtrend line on the RSI indicator that is about to break and retest, which supports the upward move.
There is a key sup
Related pairs

ALICE READY FOR BULL RUNALICE Looks Highly Oversold Here on HTF and Technicals Look Very Bullish, Sitting at Strong Liquidity Demand Zone with Breakout Confirmation. Use Proper Risk Management

ALICE USDT LONG SIGNAL---
📢 Trade Signal – ALICE/USDT
📈 Position Type: LONG
💰 Entry Price: 0.227
---
🎯 Take-Profit Targets (Partial Exits)
TP1 = 0.242
TP2 = 0.262
TP3 = 0.290
TP4 = 0.327
TP5 = —
TP6 = —
---
🛑 Stop-Loss: 0.217
📊 Timeframe: —
⚖️ Risk/Reward Ratio: 10
💥 Suggested Leverage: 5× – 10×
---
🧠 Techni

#ALICE/USDT – Potential Trend Reversal After Long Accumulation#ALICE
The price is moving within a descending channel on the 1-hour frame, adhering well to it, and heading for a strong breakout and retest.
We have a bearish trend on the RSI indicator that is about to be broken and retested, which supports the upward move.
There is a major support area in gre

ALICE$ALICE has been accumulating for nearly 1300 days, forming a strong long-term base. The structure suggests a massive upside potential of over 2000% from current levels. This is a classic high-reward setup where patience could pay off in a major way.

#ALICE/USDT#ALICE
The price is moving within a descending channel on the 1-hour frame, adhering well to it, and is heading for a strong breakout and retest.
We have a bearish trend on the RSI indicator that is about to be broken and retested, which supports the upward breakout.
There is a major support area

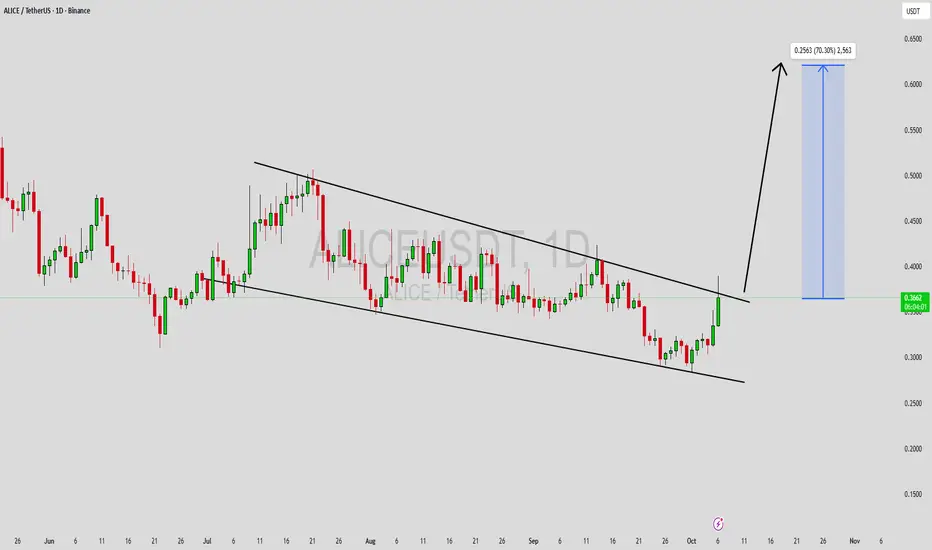
ALICEUSDT Forming Falling WedgeALICEUSDT is showing a strong technical setup with the formation of a falling wedge pattern, a structure that often precedes a bullish breakout. After a prolonged consolidation phase, price action suggests that sellers are losing momentum, and buyers are gradually stepping back in. This pattern typi

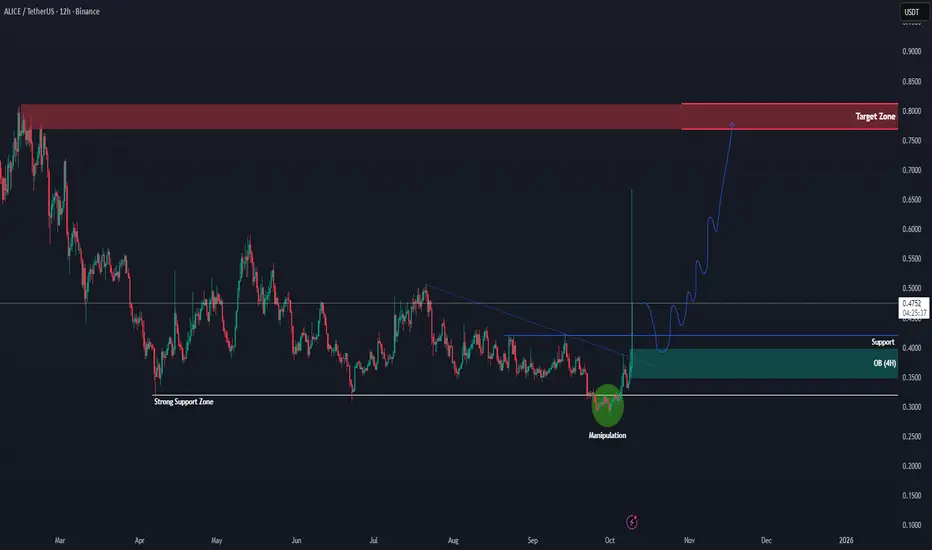
ALICEUSDT – Potential Trend Reversal After Long Accumulation PhaALICEUSDT – Potential Trend Reversal After Long Accumulation Phase
After several months of sideways movement, ALICE finally shows strong signs of reversal. The chart reveals a clear manipulation phase below the strong support zone, where price briefly dipped before quickly recovering. This manipula
ALICEUSDT Forming Falling WedgeALICEUSDT is currently showing a clear falling wedge pattern, a strong technical setup that often signals a potential bullish reversal. This pattern forms when the price consolidates lower between two converging trendlines, reflecting decreasing selling pressure and a buildup of buying interest. The
ALICEUSDT UPDATE#ALICE
UPDATE
ALICE Technical Setup
Pattern: Bullish falling wedge pattern
Current Price: $0.92
Target Price: $1.45
Target % Gain: 75.61%
$ALICE is breaking out of a falling wedge pattern on the 1D timeframe. Current price is $0.92 with a target near $1.45, showing about 57% potential upside. The

See all ideas
Summarizing what the indicators are suggesting.
Oscillators
Neutral
SellBuy
Strong sellStrong buy
Strong sellSellNeutralBuyStrong buy
Oscillators
Neutral
SellBuy
Strong sellStrong buy
Strong sellSellNeutralBuyStrong buy
Summary
Neutral
SellBuy
Strong sellStrong buy
Strong sellSellNeutralBuyStrong buy
Summary
Neutral
SellBuy
Strong sellStrong buy
Strong sellSellNeutralBuyStrong buy
Summary
Neutral
SellBuy
Strong sellStrong buy
Strong sellSellNeutralBuyStrong buy
Moving Averages
Neutral
SellBuy
Strong sellStrong buy
Strong sellSellNeutralBuyStrong buy
Moving Averages
Neutral
SellBuy
Strong sellStrong buy
Strong sellSellNeutralBuyStrong buy
Displays a symbol's price movements over previous years to identify recurring trends.
Frequently Asked Questions
The current price of ALICE / Tether USD (ALICE) is 0.2271 USDT — it has fallen −1.13% in the past 24 hours. Try placing this info into the context by checking out what coins are also gaining and losing at the moment and seeing ALICE price chart.
ALICE / Tether USD price has fallen by −0.48% over the last week, its month performance shows a −15.01% decrease, and as for the last year, ALICE / Tether USD has decreased by −87.74%. See more dynamics on ALICE price chart.
Keep track of coins' changes with our Crypto Coins Heatmap.
Keep track of coins' changes with our Crypto Coins Heatmap.
ALICE / Tether USD (ALICE) reached its highest price on Dec 2, 2021 — it amounted to 23.1849 USDT. Find more insights on the ALICE price chart.
See the list of crypto gainers and choose what best fits your strategy.
See the list of crypto gainers and choose what best fits your strategy.
ALICE / Tether USD (ALICE) reached the lowest price of 0.1909 USDT on Oct 11, 2025. View more ALICE / Tether USD dynamics on the price chart.
See the list of crypto losers to find unexpected opportunities.
See the list of crypto losers to find unexpected opportunities.
The safest choice when buying ALICE is to go to a well-known crypto exchange. Some of the popular names are Binance, Coinbase, Kraken. But you'll have to find a reliable broker and create an account first. You can trade ALICE right from TradingView charts — just choose a broker and connect to your account.
Crypto markets are famous for their volatility, so one should study all the available stats before adding crypto assets to their portfolio. Very often it's technical analysis that comes in handy. We prepared technical ratings for ALICE / Tether USD (ALICE): today its technical analysis shows the sell signal, and according to the 1 week rating ALICE shows the sell signal. And you'd better dig deeper and study 1 month rating too — it's sell. Find inspiration in ALICE / Tether USD trading ideas and keep track of what's moving crypto markets with our crypto news feed.
ALICE / Tether USD (ALICE) is just as reliable as any other crypto asset — this corner of the world market is highly volatile. Today, for instance, ALICE / Tether USD is estimated as 5.03% volatile. The only thing it means is that you must prepare and examine all available information before making a decision. And if you're not sure about ALICE / Tether USD, you can find more inspiration in our curated watchlists.
You can discuss ALICE / Tether USD (ALICE) with other users in our public chats, Minds or in the comments to Ideas.