ALTUSDT 1D#ALT is currently trading within a falling wedge pattern on the daily chart. In case of a successful bounce from the support zone and a breakout above the wedge resistance and the daily EMA100, the potential upside targets are:
🎯 $0.02564
🎯 $0.03139
🎯 $0.03603
🎯 $0.04068
🎯 $0.04729
🎯 $0.05572
⚠️ A
Related pairs

ALTUSDT Forming Bullish WaveALTUSDT is currently forming a bullish wavering wedge pattern, which is often seen as a strong reversal signal indicating potential upward momentum. The pattern highlights a period of consolidation where the price narrows between converging trendlines before breaking out with significant force. In A

ALT analysisPrice is currently trading between the support and resistance areas. You can accumulate near the support area, as I expect a move toward the resistance area in the coming days.
Support Area: $0.02380-$0.02580
Resistance Area: $0.04200-$0.04420

ALTUSDT 1D#ALT is moving near the descending trendline and is on the verge of breaking out above it, with the daily SMA200 acting as strong support. If a breakout occurs, the potential targets are:
🎯 $0.04249
🎯 $0.04878
🎯 $0.05506
🎯 $0.06401
🎯 $0.07541
⚠️ As always, use a tight stop-loss and apply proper ri

ALT/USDT — Descending Triangle: Breakout or Breakdown?🔎 Overview
ALT/USDT has been in a prolonged downtrend since 2024, consistently forming lower highs along a descending trendline. At the same time, buyers continue to defend the support base at 0.028–0.031 USDT, creating a clear Descending Triangle pattern.
Currently, price action is consolidating
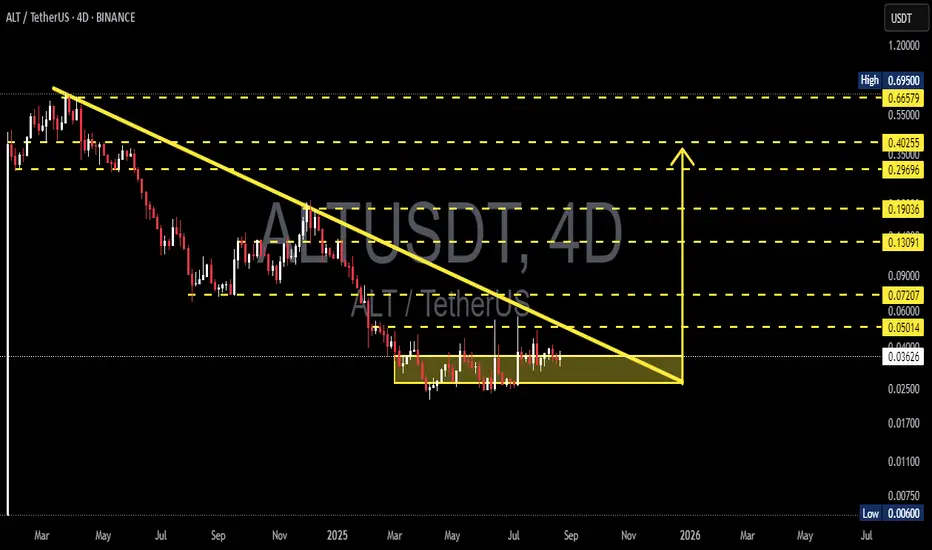
$ALT/USDT Breakout Loading"NASDAQ:ALT has been in a downtrend for a long time, but it has been quietly consolidating for months.
Now it’s pushing towards a key trendline.
If it breaks out, we could be looking at a massive move toward $0.70951, which is over 1,500% from here.
DYOR, NFA

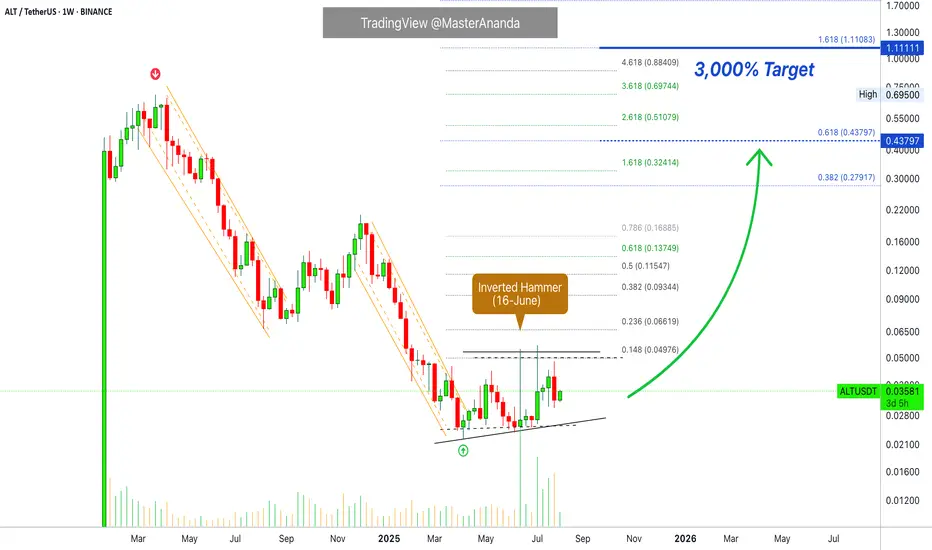
AltLayer 3,000% Late 2025 Target · Bottom ConfirmedThis is a perfect chart. You can see the same drawings made by the candles compared to other altcoins we've been visiting. For example, the main low happened 7-April 2025, four months ago. So AltLayer hit bottom and has been consolidating slowly moving up.
Notice higher lows. Notice how after more
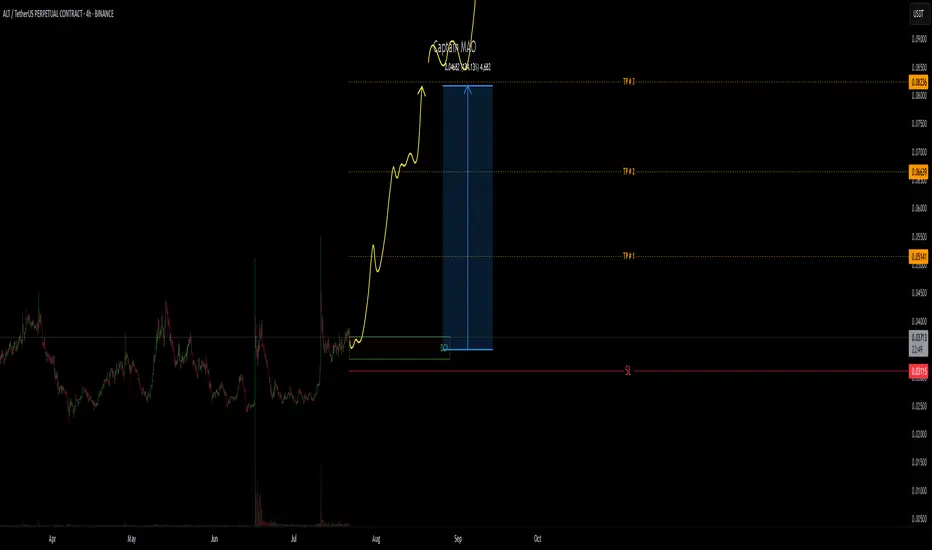
ALT/USDT - Superbullish ALT/USDT is shaping a superbullish market structure, driven by aggressive buyer pressure and consistent demand. Price has repeatedly defended the $0.035 zone, which now stands out as a strong base support—a clear sign of accumulation and market confidence.
This level has acted as a springboard for
ALTUSDT Forming Bullish ReversalALTUSDT is currently displaying a bullish reversal pattern that may mark the beginning of a significant trend change. After a prolonged period of downward or sideways movement, the asset has shown signs of accumulation, with increasing volume and a shift in price structure. This type of reversal for

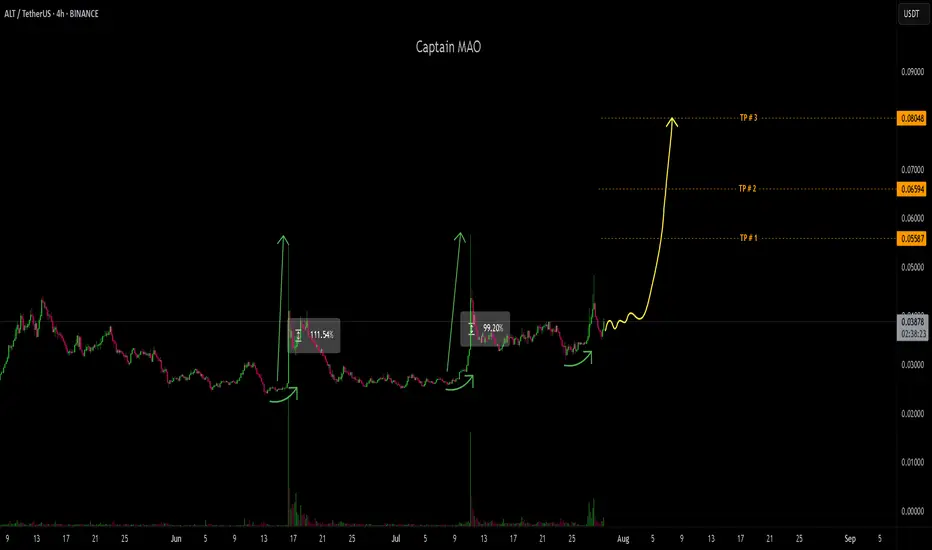
ALT/USDT - Parabolic moveis preparing for its next parabolic move. Over the past 10 days, price has established a solid base support around the $0.033 zone, consolidating in a tight range. This accumulation structure suggests that a breakout and strong upward leg could be imminent.
See all ideas
Summarizing what the indicators are suggesting.
Oscillators
Neutral
SellBuy
Strong sellStrong buy
Strong sellSellNeutralBuyStrong buy
Oscillators
Neutral
SellBuy
Strong sellStrong buy
Strong sellSellNeutralBuyStrong buy
Summary
Neutral
SellBuy
Strong sellStrong buy
Strong sellSellNeutralBuyStrong buy
Summary
Neutral
SellBuy
Strong sellStrong buy
Strong sellSellNeutralBuyStrong buy
Summary
Neutral
SellBuy
Strong sellStrong buy
Strong sellSellNeutralBuyStrong buy
Moving Averages
Neutral
SellBuy
Strong sellStrong buy
Strong sellSellNeutralBuyStrong buy
Moving Averages
Neutral
SellBuy
Strong sellStrong buy
Strong sellSellNeutralBuyStrong buy
Displays a symbol's price movements over previous years to identify recurring trends.
Frequently Asked Questions
The current price of ALT / USDT Spot Trading Pair (ALT) is 0.01176 USDT — it has risen 0.76% in the past 24 hours. Try placing this info into the context by checking out what coins are also gaining and losing at the moment and seeing ALT price chart.
ALT / USDT Spot Trading Pair price has fallen by −9.26% over the last week, its month performance shows a −21.57% decrease, and as for the last year, ALT / USDT Spot Trading Pair has decreased by −92.88%. See more dynamics on ALT price chart.
Keep track of coins' changes with our Crypto Coins Heatmap.
Keep track of coins' changes with our Crypto Coins Heatmap.
ALT / USDT Spot Trading Pair (ALT) reached its highest price on Mar 27, 2024 — it amounted to 0.69600 USDT. Find more insights on the ALT price chart.
See the list of crypto gainers and choose what best fits your strategy.
See the list of crypto gainers and choose what best fits your strategy.
ALT / USDT Spot Trading Pair (ALT) reached the lowest price of 0.00832 USDT on Oct 10, 2025. View more ALT / USDT Spot Trading Pair dynamics on the price chart.
See the list of crypto losers to find unexpected opportunities.
See the list of crypto losers to find unexpected opportunities.
The safest choice when buying ALT is to go to a well-known crypto exchange. Some of the popular names are Binance, Coinbase, Kraken. But you'll have to find a reliable broker and create an account first. You can trade ALT right from TradingView charts — just choose a broker and connect to your account.
Crypto markets are famous for their volatility, so one should study all the available stats before adding crypto assets to their portfolio. Very often it's technical analysis that comes in handy. We prepared technical ratings for ALT / USDT Spot Trading Pair (ALT): today its technical analysis shows the sell signal, and according to the 1 week rating ALT shows the sell signal. And you'd better dig deeper and study 1 month rating too — it's sell. Find inspiration in ALT / USDT Spot Trading Pair trading ideas and keep track of what's moving crypto markets with our crypto news feed.
ALT / USDT Spot Trading Pair (ALT) is just as reliable as any other crypto asset — this corner of the world market is highly volatile. Today, for instance, ALT / USDT Spot Trading Pair is estimated as 2.73% volatile. The only thing it means is that you must prepare and examine all available information before making a decision. And if you're not sure about ALT / USDT Spot Trading Pair, you can find more inspiration in our curated watchlists.
You can discuss ALT / USDT Spot Trading Pair (ALT) with other users in our public chats, Minds or in the comments to Ideas.