
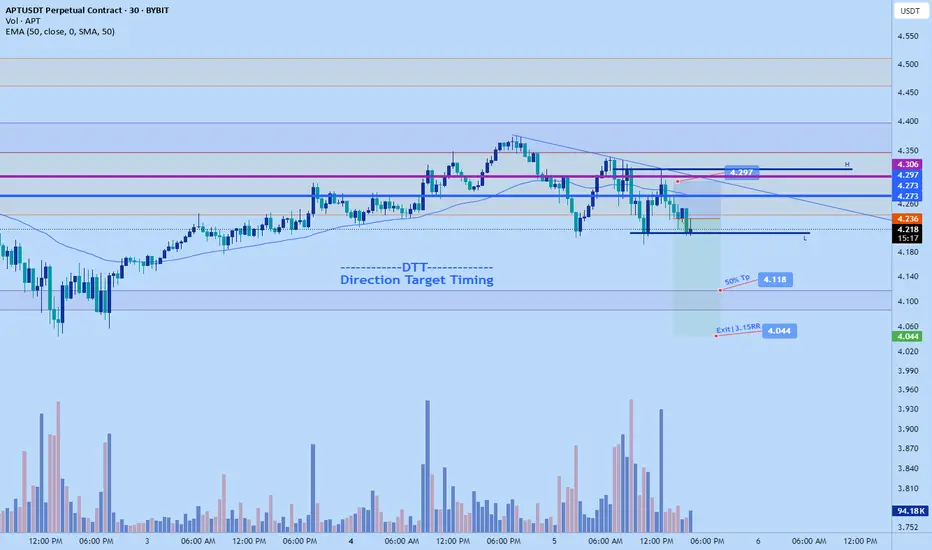
Aptos short to $4.044sl: 4.297 or higher
Tp1: 4.118---50%
full exit at $4.044
Overall market seems to be breaking back down and aptos also looks like to do so as market have flipped bearish on 1hr to 4hr tf aligning with daily downtrend. Anticipating new lower lows.
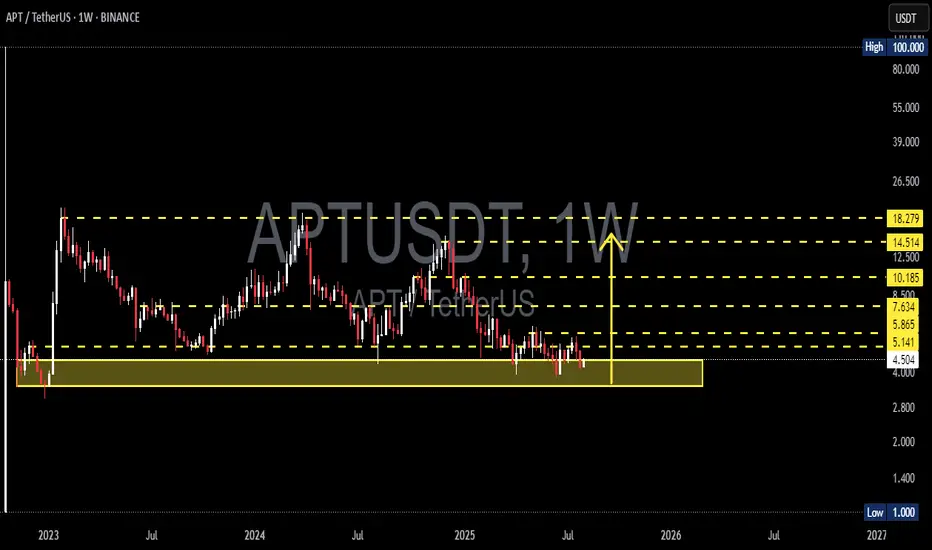
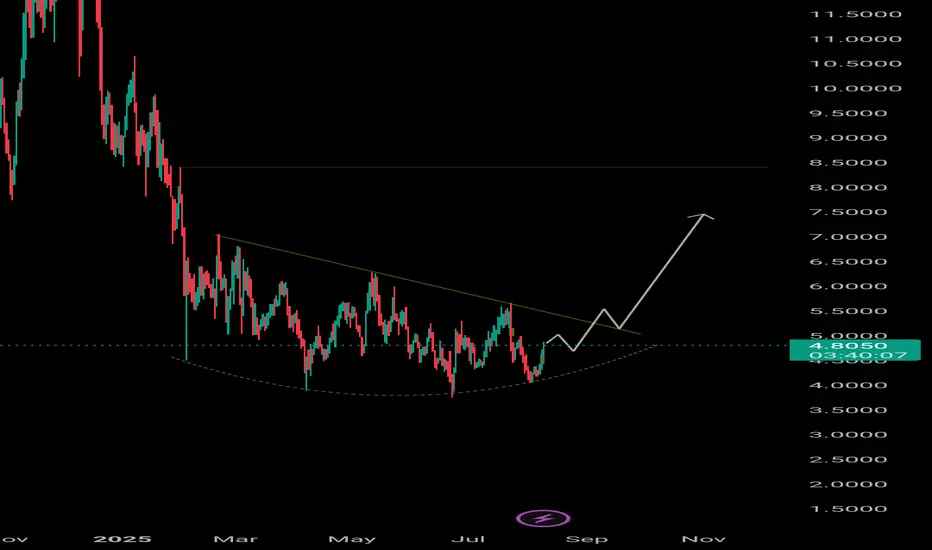
Aptus Apt usdt Daily analysis
Time frame daily
Risk rewards ratio >2 👈👌
Target 7.4$
Pattern = two bottom

#APT/USDT Buyers Need To Establish Support Zone#APT
The price is moving within an ascending channel on the 1-hour frame, adhering well to it, and is on track to break it strongly upwards and retest it.
We have support from the lower boundary of the ascending channel, at 4.68.
We have a downtrend on the RSI indicator that is about to break and

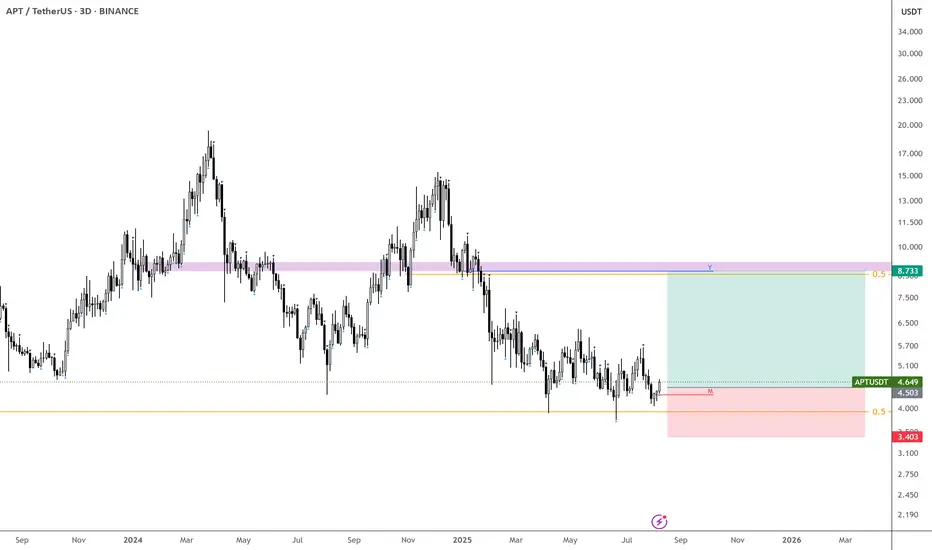
APT/USDT – Price Tests Critical Historical Demand Zone!📌 Quick Summary:
APT is now at a crucial technical crossroad. After a prolonged downtrend from its previous highs, price action is once again testing the strong demand zone that historically acted as a key accumulation area. Is this the start of a new rally, or a breakdown toward uncharted lows?
-
Feeling Optimistic About $APTI know… it’s been over 8 months. And truth be told, AMEX:APT and I have had our ups and downs—especially between June and Oct 2023. Our relationship isn’t perfect.
But right now? This is a great technical spot. Trend is still technically down, but we’re finally seeing signs of a reversal into a k
APT Accumulation pt.3I am watching this for ages now. At the current state it's an extended model 1 that went over in a model 2. If it wants to create a bigger range here then it would be fine, as long as the 3rd tap stays intact.
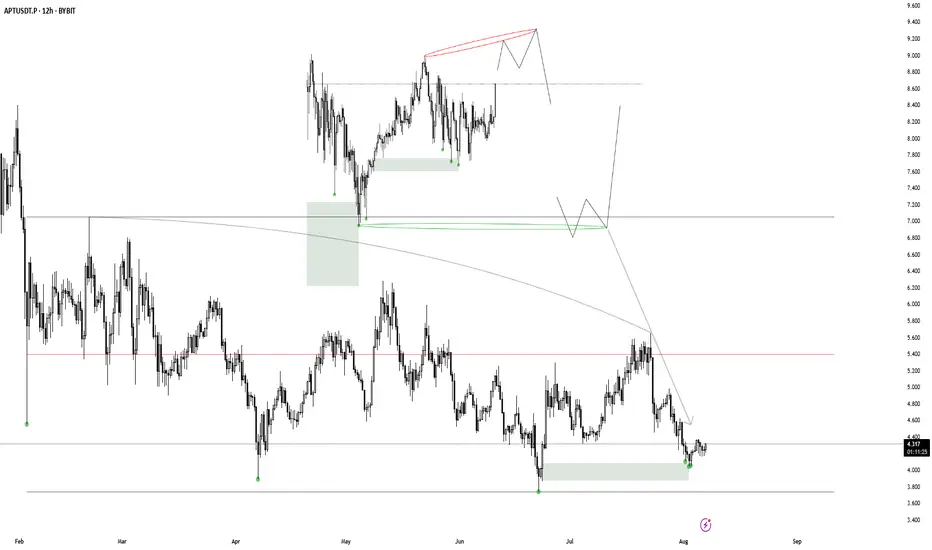
Aptos (APT): Zone of Liquidity or Zone of Breakout? APT seems to form a double bottom pattern here, where we are looking for a proper breakout of that neckline zone, after which we are going to look for a long position here as well!
Swallow Academy
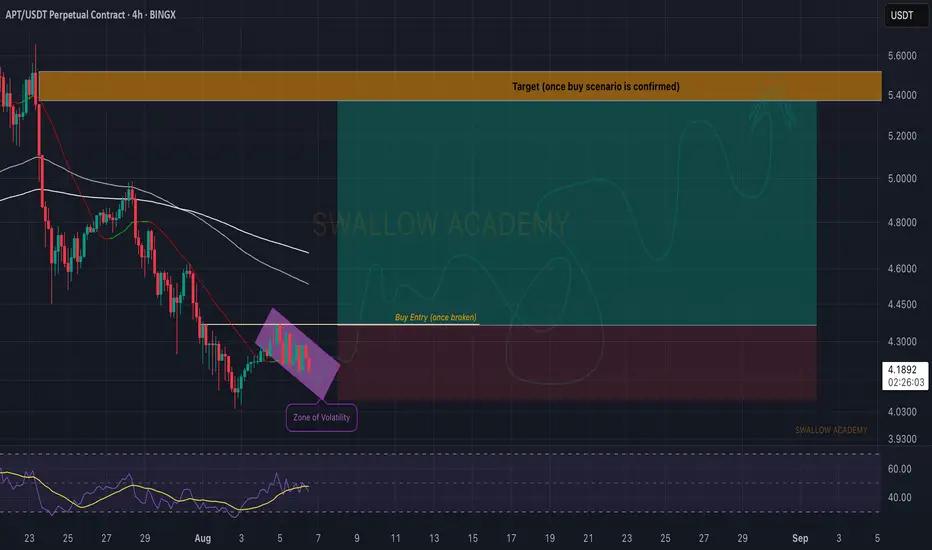
Apt/usdt Bull Analysis AMEX:APT holders will be smiling very soon ❤️
AMEX:APT is forming a beautiful rounded bottom, showing signs of a potential trend reversal. 📈
I’ll be watching closely for a breakout above the descending trendline — but my entry will only be on confirmation in the marked red zone.
If it plays
#APT/USDT Buyers Need To Establish Support Zone#APT
The price is moving within an ascending channel on the 1-hour frame, adhering well to it, and is on its way to break strongly upwards and retest it.
We have support from the lower boundary of the ascending channel, at 4.10.
We have a downtrend on the RSI indicator that is about to break and

See all ideas
Summarizing what the indicators are suggesting.
Oscillators
Neutral
SellBuy
Strong sellStrong buy
Strong sellSellNeutralBuyStrong buy
Oscillators
Neutral
SellBuy
Strong sellStrong buy
Strong sellSellNeutralBuyStrong buy
Summary
Neutral
SellBuy
Strong sellStrong buy
Strong sellSellNeutralBuyStrong buy
Summary
Neutral
SellBuy
Strong sellStrong buy
Strong sellSellNeutralBuyStrong buy
Summary
Neutral
SellBuy
Strong sellStrong buy
Strong sellSellNeutralBuyStrong buy
Moving Averages
Neutral
SellBuy
Strong sellStrong buy
Strong sellSellNeutralBuyStrong buy
Moving Averages
Neutral
SellBuy
Strong sellStrong buy
Strong sellSellNeutralBuyStrong buy
Displays a symbol's price movements over previous years to identify recurring trends.