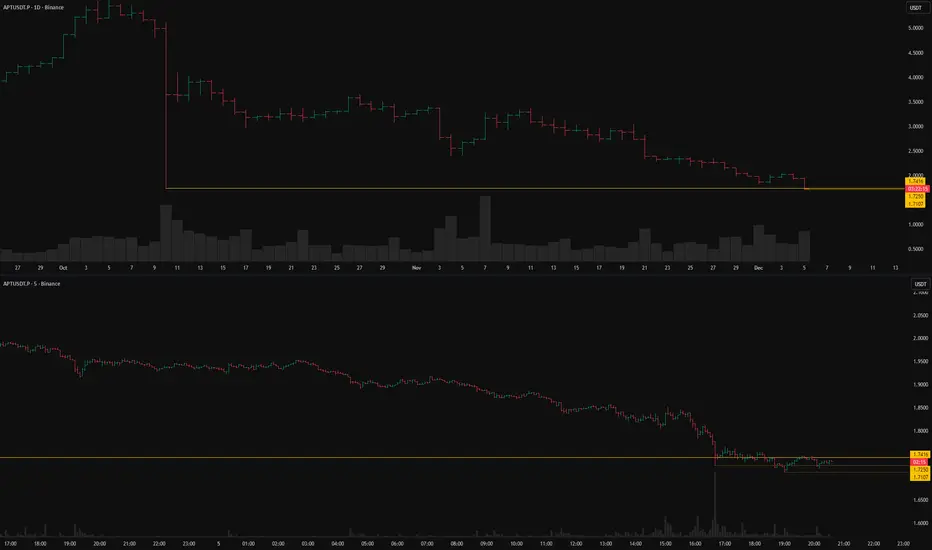
APTUSDT: short setup from daily support at 1.7416BINANCE:APTUSDT.P has approached a strong level at 1.7416. Today we are seeing a breakout attempt, but the lack of impulse suggests it might be a false break. However, we are also missing the sharp rejection (bounce) typical of a defended level. Instead, the price is "sawing" around the level. Ther
Related pairs
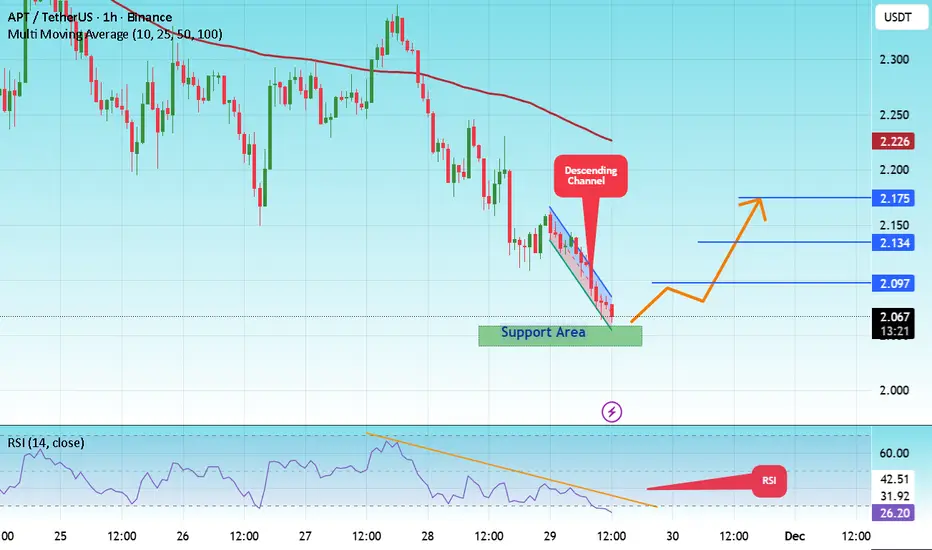
#APT/USDT 1H – Stablecoin-heavy, swing long from local base#APT
The price is moving in a descending channel on the 1-hour timeframe. It has reached the lower boundary and is heading towards a breakout, with a retest of the upper boundary expected.
We are seeing a bearish bias in the Relative Strength Index (RSI), which has reached near the lower boundary,
Aptos (APT): Entering The Local Lows | Looking For BounceAPT kept breaking lows step by step and finally tapped the main local low. This is the first place where buyers can try to build something, but we don’t have any real shift yet — just a reaction from the zone.
What we need now is a clean break of structure to confirm the reversal attempt. Until tha

APT USDT LONG SIGNAL---
📢 Official Trade Signal – APT/USDT
📈 Position Type: LONG
💰 Entry Price: 1.7780
---
🎯 Take-Profit Targets (Partial Exits):
• TP1: 1.8100
• TP2: 1.8480
• TP3: 1.8880
• TP4: 1.9214
• TP5: 1.9532
• TP6: 2.0000
---
🛑 Stop-Loss: 1.7200
📊 Timeframe: 15m
⚖️ Risk/Reward Ratio: ≈ 2.34 (based on TP6)

APTUSDT - bullish divergences APT has been in a sustained downtrend, forming a series of lower lows on the daily chart. However, the recent price action shows a bullish divergence between price and RSI:
1. Bullish Divergence
Price has made a lower low.
RSI has made a higher low.
This suggests weakening bearish momentum and a

APT is forming a Double Bottom pattern🚨📊 APT Update
APT is forming a Double Bottom pattern,
a bullish reversal setup 🔄📈.
If price breaks out above the red resistance zone,
the first target will be the green line level 🟩🎯.

APT - BEARISH OUTLOOKAMEX:APT - Bearish Setup 📉
Same story: no buy pressure, strong downtrend & no historical support.🔴
Price looks ready to break to the downside once again.
Potential key support:
$ 1.510 and $1.380 level (0.706 fib).
Chart looks terrible under the key resistances mentioned. 🍿📉

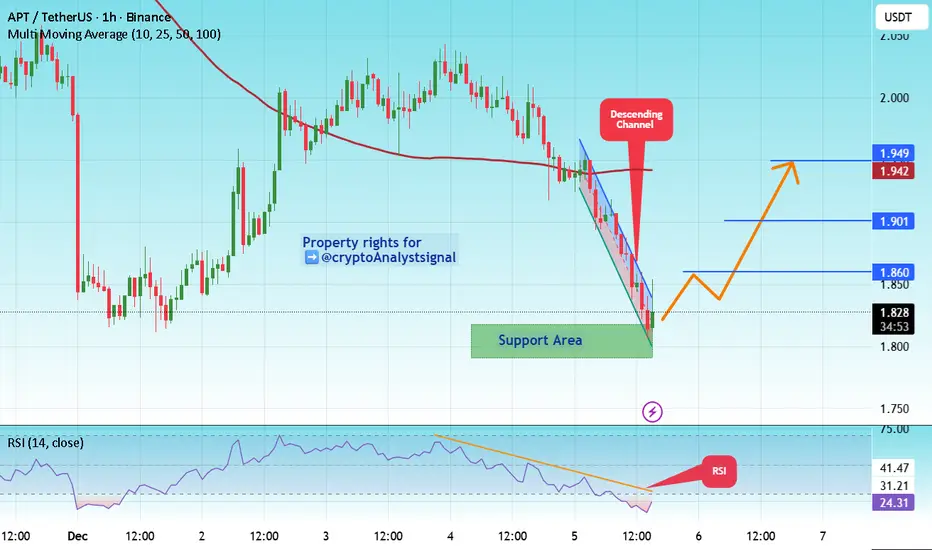
#APT/USDT 1H – Stablecoin-heavy, swing long from local base#APT
The price is moving in a descending channel on the 1-hour timeframe. It has reached the lower boundary and is heading towards a breakout, with a retest of the upper boundary expected.
We are seeing a bearish bias in the Relative Strength Index (RSI), which has reached near the lower boundary,
apt long ideaapt usdt long ✅
ENTRY : 1.8270 - 1.7800✅
TARGETS :
1.8295
1.8320
1.8355
1.8370
1.8420
1.8490
1.8560
1.8600
1.8720
1.8900
1.9120
1.9240
1.9500
1.9710
1.9950
2.0500
2.0900
2.1200
2.1500
STOPLOSS : 1.7200 ✅
🔴RISKY TRADE USE LOW FUNDS !

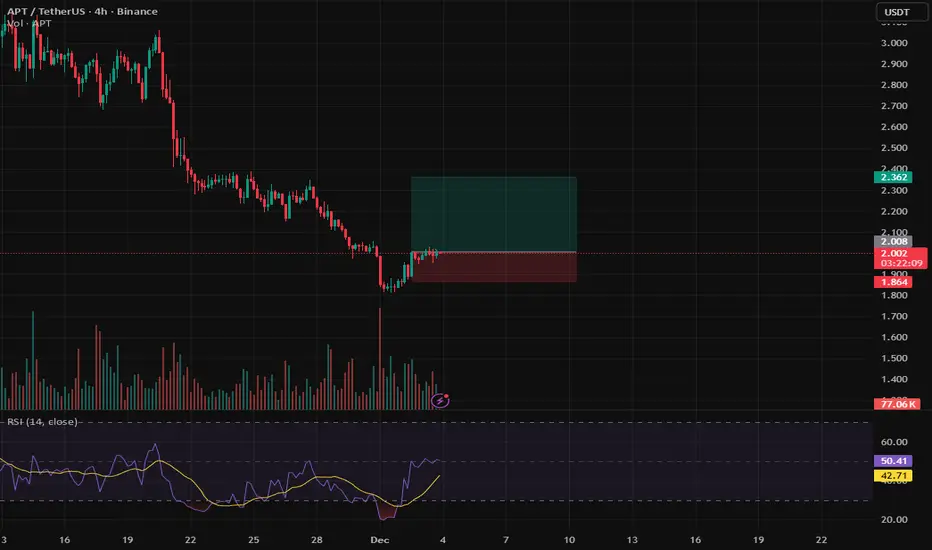
showing signs of a potential reversal with increasing demand at Price is currently retesting the breakout zone after the first impulsive push upward. As long as this retest holds, the market has room to continue toward the next liquidity area. Stop-loss is placed below the recent higher low, maintaining a clean invalidation level for the setup.
See all ideas
Summarizing what the indicators are suggesting.
Oscillators
Neutral
SellBuy
Strong sellStrong buy
Strong sellSellNeutralBuyStrong buy
Oscillators
Neutral
SellBuy
Strong sellStrong buy
Strong sellSellNeutralBuyStrong buy
Summary
Neutral
SellBuy
Strong sellStrong buy
Strong sellSellNeutralBuyStrong buy
Summary
Neutral
SellBuy
Strong sellStrong buy
Strong sellSellNeutralBuyStrong buy
Summary
Neutral
SellBuy
Strong sellStrong buy
Strong sellSellNeutralBuyStrong buy
Moving Averages
Neutral
SellBuy
Strong sellStrong buy
Strong sellSellNeutralBuyStrong buy
Moving Averages
Neutral
SellBuy
Strong sellStrong buy
Strong sellSellNeutralBuyStrong buy
Displays a symbol's price movements over previous years to identify recurring trends.
Frequently Asked Questions
The current price of APT / TetherUS (APT) is 1.629 USDT — it has fallen −5.39% in the past 24 hours. Try placing this info into the context by checking out what coins are also gaining and losing at the moment and seeing APT price chart.
APT / TetherUS price has fallen by −15.70% over the last week, its month performance shows a −47.24% decrease, and as for the last year, APT / TetherUS has decreased by −88.09%. See more dynamics on APT price chart.
Keep track of coins' changes with our Crypto Coins Heatmap.
Keep track of coins' changes with our Crypto Coins Heatmap.
APT / TetherUS (APT) reached its highest price on Oct 19, 2022 — it amounted to 100.000 USDT. Find more insights on the APT price chart.
See the list of crypto gainers and choose what best fits your strategy.
See the list of crypto gainers and choose what best fits your strategy.
APT / TetherUS (APT) reached the lowest price of 0.747 USDT on Oct 10, 2025. View more APT / TetherUS dynamics on the price chart.
See the list of crypto losers to find unexpected opportunities.
See the list of crypto losers to find unexpected opportunities.
The safest choice when buying APT is to go to a well-known crypto exchange. Some of the popular names are Binance, Coinbase, Kraken. But you'll have to find a reliable broker and create an account first. You can trade APT right from TradingView charts — just choose a broker and connect to your account.
Crypto markets are famous for their volatility, so one should study all the available stats before adding crypto assets to their portfolio. Very often it's technical analysis that comes in handy. We prepared technical ratings for APT / TetherUS (APT): today its technical analysis shows the sell signal, and according to the 1 week rating APT shows the sell signal. And you'd better dig deeper and study 1 month rating too — it's sell. Find inspiration in APT / TetherUS trading ideas and keep track of what's moving crypto markets with our crypto news feed.
APT / TetherUS (APT) is just as reliable as any other crypto asset — this corner of the world market is highly volatile. Today, for instance, APT / TetherUS is estimated as 0.74% volatile. The only thing it means is that you must prepare and examine all available information before making a decision. And if you're not sure about APT / TetherUS, you can find more inspiration in our curated watchlists.
You can discuss APT / TetherUS (APT) with other users in our public chats, Minds or in the comments to Ideas.