Arc Correction - ShortAttempting a Short here at Resistance targeting the POC across these recent swings.

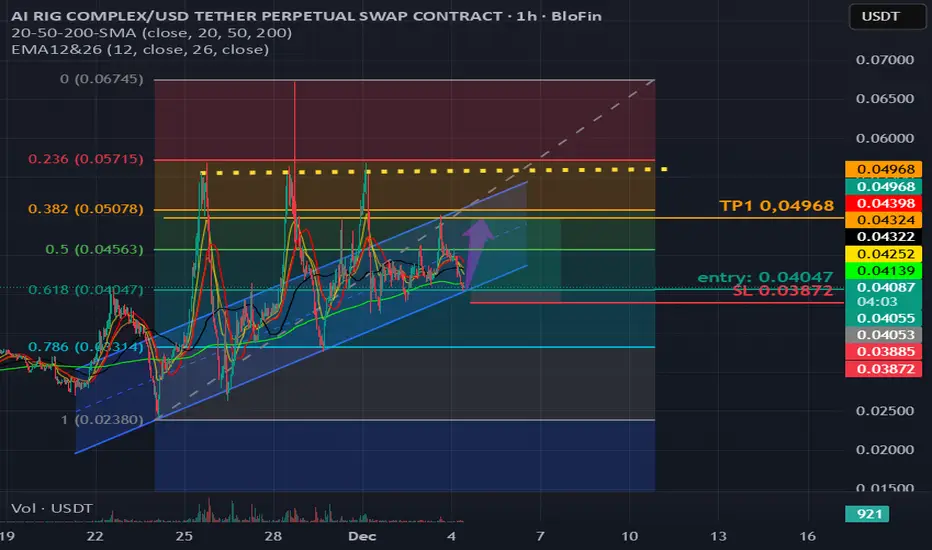
ARC/USDT on 1 hour timeframe upwards potentialThe price is hovering just above the 0.618 Fibonacci retracement level (0.04047), which is often seen as a strong support zone in bullish setups
Entry: 0.04047
Stop Loss (SL): 0.03872 (below support zone)
Take Profit (TP1): 0.04968 (near 0.382 retracement)
Risk/Reward Ratio: Favorable, assuming bo
ARC Buy/Long Insight (4H)The ARC structure has gained strong bullish momentum after the main CH, and continuous bullish BOS can be seen on the chart.
After the liquidity sweep, the price has moved upward again. By tracking the structure, it becomes clear that the price is aiming to reach the higher-timeframe supply zones,


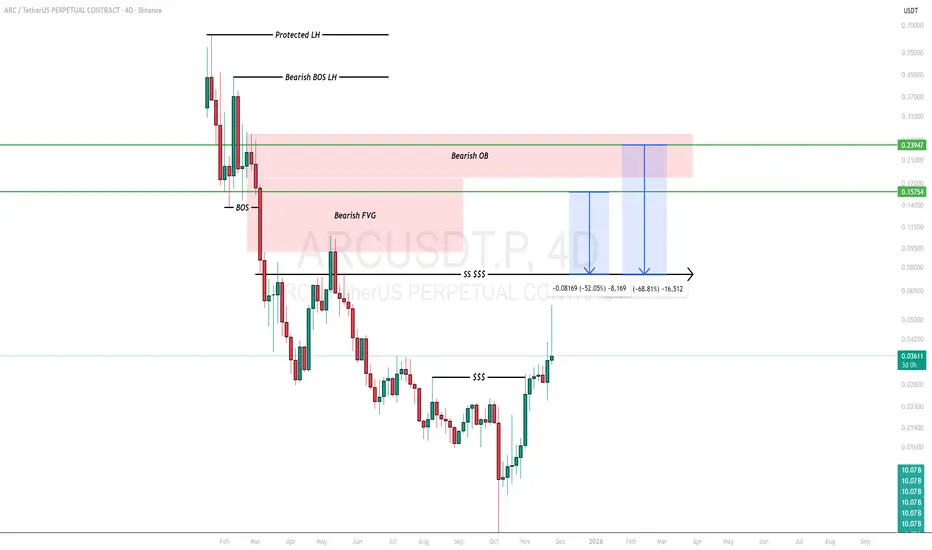
ARCUSDT Trading Idea.Likely a reversal to the downside.
📍Probable Entries
📌 $0.23947
📌 $0.15754
📈 The preferred position should be a short position.
Trade safe and smart
ARC BOTTOMED OUTPrice more than 90% down in past few months but technicals showing bullish reversal now. Use Proper risk management as it's highly risky

ARCUSDT.PTESTING D WATERS ON NEW TECHNIQUE……
Been too long away from D market but A skill can never leave THEE when YOU sync In….

ARC - READY TO MOON ?? Im still holding LSE:ARC and it's likely to explode soon; here's why:
📈Multi month wedge
📈Strong buy volume (weekly) |accumulation]
📈Bullish pennant
Moonshot incoming soon?

ARCUSDT - Bullish Breakout Confirmed ARC has been trading in a well-defined descending channel for several weeks, forming a consistent downtrend. However, the price has now broken out of the channel resistance, signaling a potential bullish reversal.
Descending Channel Breakout: ARC has clearly broken above the channel’s upper trendli

$ARC - Long SetupBITGET:ARCUSDT | 1D
We can risk on cmp but leave something for dca if it dips a bit around .060 to .056
If we can hold .060 to .056, we can target .068 (initial) to .16 (final)
Stoploss just below .05 to .047
Targets:
.068 - .076
.090 - .106
.132 - .162

See all ideas
Summarizing what the indicators are suggesting.
Oscillators
Neutral
SellBuy
Strong sellStrong buy
Strong sellSellNeutralBuyStrong buy
Oscillators
Neutral
SellBuy
Strong sellStrong buy
Strong sellSellNeutralBuyStrong buy
Summary
Neutral
SellBuy
Strong sellStrong buy
Strong sellSellNeutralBuyStrong buy
Summary
Neutral
SellBuy
Strong sellStrong buy
Strong sellSellNeutralBuyStrong buy
Summary
Neutral
SellBuy
Strong sellStrong buy
Strong sellSellNeutralBuyStrong buy
Moving Averages
Neutral
SellBuy
Strong sellStrong buy
Strong sellSellNeutralBuyStrong buy
Moving Averages
Neutral
SellBuy
Strong sellStrong buy
Strong sellSellNeutralBuyStrong buy