A demand zone on the 4-hour timeframe ARKM is currently trading in a strong demand zone between 0.22 and 0.20, with a possible dip toward 0.180. The main target remains at 0.38. These levels offer a solid opportunity for buyers who are monitoring the setup closely. BINANCE:ARKMUSDT

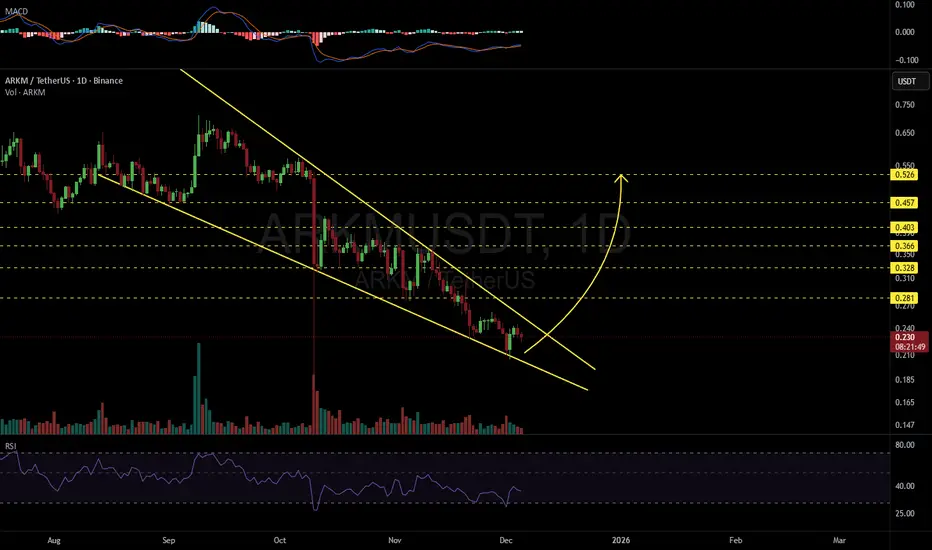
ARKMUSDT 1D#ARKM is moving inside a falling wedge on the daily chart. It may retest the wedge support one more time before the next leg up. In case of a successful bounce from the support and a breakout above the wedge, the potential targets are:
🎯 $0.281
🎯 $0.328
🎯 $0.366
🎯 $0.403
🎯 $0.457
🎯 $0.526
❌ Invali

ARKM/USDT – Bullish Continuation Pattern with Upside Potential
Date: July 18, 2025
ARKM/USDT is showing renewed bullish momentum after a prolonged accumulation phase. The price has broken out of a tight range and is now pushing above key moving averages with volume support, indicating a potential trend reversal and upside continuation.
📊 Technical Overview:

ARKM LONG1. Chart Context
Pair: ARKM/USDT
Timeframe: 1h
Current Price: ≈ 0.386 USDT
The market has recently consolidated after a drop and is showing signs of holding support.
2. Trade Setup
This is a long position (expecting price to rise).
The colored box (green/red) represents the Risk/Reward (R:R) setup:

ARKM/USDT — Major Reversal Incoming or Final Breakdown?Overview
ARKM is now trading at its most critical level since the explosive rally of 2024.
The latest 5D candle shows a sharp drop followed by a long lower wick, briefly breaking below the $0.375–$0.280 support zone before rebounding — a classic sign of a liquidity sweep and potential buyer absorpt

Arkm's price may drop more and more.Arkm may provide a good opportunity for long-term buying in the coming months. Most likely in the autumn months.
* The purpose of my graphic drawings is purely educational.
* What i write here is not an investment advice. Please do your own research before investing in any asset.
* Never take my

I am Bullish on ARKMUSDTAfter a critical analysis, I have come to a conclusion that #Arkmusdt is approaching a very key zone where buying will be a good idea. I believe as BTC retrace to a key zone to wipe unmitigated zone these pairs could do the same.

BUFFALO | $ARKM is going goodOverall, the monthly timeframe of ARKM is showing a clear compression phase, characterized by large-volume doji candles — a sign that strong accumulation is taking place at current levels. After an extended downtrend, the current price structure indicates that selling pressure is weakening, while bu

ARKM 1H AnalysisHere is an analysis of ARKM on 1 Hour time frame. ARKM key buying area and expected targets are given on chart. DYOR NFA

See all ideas
Summarizing what the indicators are suggesting.
Oscillators
Neutral
SellBuy
Strong sellStrong buy
Strong sellSellNeutralBuyStrong buy
Oscillators
Neutral
SellBuy
Strong sellStrong buy
Strong sellSellNeutralBuyStrong buy
Summary
Neutral
SellBuy
Strong sellStrong buy
Strong sellSellNeutralBuyStrong buy
Summary
Neutral
SellBuy
Strong sellStrong buy
Strong sellSellNeutralBuyStrong buy
Summary
Neutral
SellBuy
Strong sellStrong buy
Strong sellSellNeutralBuyStrong buy
Moving Averages
Neutral
SellBuy
Strong sellStrong buy
Strong sellSellNeutralBuyStrong buy
Moving Averages
Neutral
SellBuy
Strong sellStrong buy
Strong sellSellNeutralBuyStrong buy
Displays a symbol's price movements over previous years to identify recurring trends.