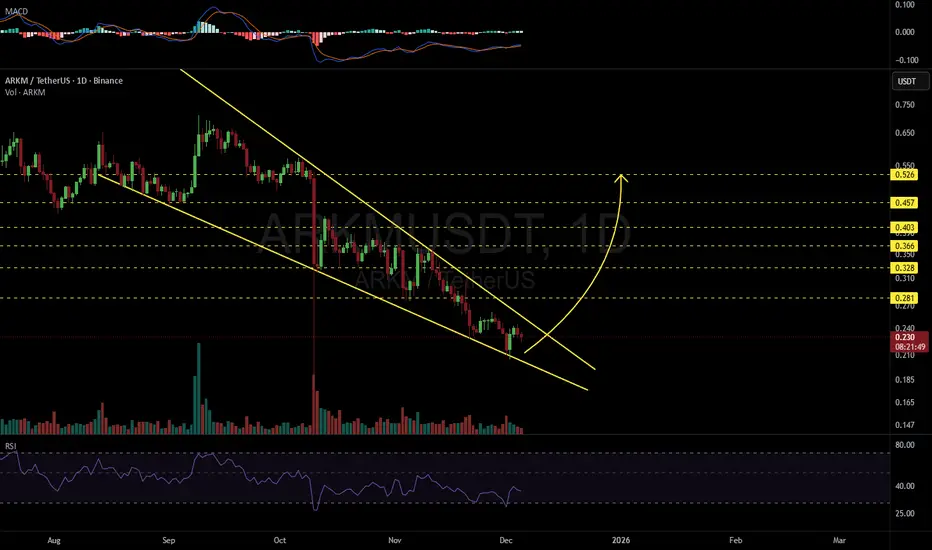
ARKMUSDT 1D#ARKM is moving inside a falling wedge on the daily chart. It may retest the wedge support one more time before the next leg up. In case of a successful bounce from the support and a breakout above the wedge, the potential targets are:
🎯 $0.281
🎯 $0.328
🎯 $0.366
🎯 $0.403
🎯 $0.457
🎯 $0.526
❌ Invalidation: a daily candle closing below the wedge.
⚠️ Always remember to use a tight stop-loss and maintain proper risk management.
Market insights
A demand zone on the 4-hour timeframe ARKM is currently trading in a strong demand zone between 0.22 and 0.20, with a possible dip toward 0.180. The main target remains at 0.38. These levels offer a solid opportunity for buyers who are monitoring the setup closely. BINANCE:ARKMUSDT


ARKM/USDT – Bullish Continuation Pattern with Upside Potential
Date: July 18, 2025
ARKM/USDT is showing renewed bullish momentum after a prolonged accumulation phase. The price has broken out of a tight range and is now pushing above key moving averages with volume support, indicating a potential trend reversal and upside continuation.
📊 Technical Overview:
Current Price: $0.601
EMA Alignment: Price is currently above the 4EMA, 50EMA, and 100EMA, suggesting growing short-term strength. Still trading below the 200EMA (~$0.695), which could act as resistance.
Structure: Strong breakout from a horizontal consolidation range. The pattern resembles an accumulation zone followed by an impulsive move.
📉 Support Zones:
$0.585 (minor support – recent breakout level)
$0.400 (major accumulation base and demand zone)
📈 Resistance/Target Zones:
Immediate Target: $0.749–$0.793 (horizontal resistance from past price action)
Mid-Term Target: $1.328–$1.409 (projected target based on height of the accumulation box)
📊 Indicators:
RSI: 67.84 – bullish momentum increasing, nearing overbought territory but not yet exhausted
Volume: Volume increasing on green candles – confirms buyer interest and breakout legitimacy
🔍 Chart Structure:
Price spent several months inside a wide consolidation box between ~$0.40 and ~$0.75.
The recent breakout from a smaller mini-range inside the larger zone suggests a renewed push toward upper resistance.
The pattern projection points to a possible move back to the $1.30+ zone in the medium term.
🎯 Upside Projections:
Short-Term Target: $0.749–$0.793
Mid-Term Target: $1.328–$1.409
These levels correspond to past structural resistances and measured breakout moves.
📉 Invalidation:
Breakdown below $0.585 would invalidate the short-term bullish setup.
Falling back into the $0.40–$0.50 zone would indicate weakness and likely further consolidation.

ARKM LONG1. Chart Context
Pair: ARKM/USDT
Timeframe: 1h
Current Price: ≈ 0.386 USDT
The market has recently consolidated after a drop and is showing signs of holding support.
2. Trade Setup
This is a long position (expecting price to rise).
The colored box (green/red) represents the Risk/Reward (R:R) setup:
Entry Zone: Around 0.386 USDT (current price sitting at support).
Stop Loss (SL): 0.358 USDT (bottom of the red box).
If price falls below this support zone, the long trade is invalidated.
Take Profit (TP): 0.427 USDT (top of the green box).
Targeting a push back to resistance above 0.42.
3. Risk/Reward Ratio
Risk (SL distance): ~0.028 USDT
Reward (TP distance): ~0.041 USDT
R:R ratio ≈ 1.46:1
A solid setup, with more potential reward than risk.
4. Support & Resistance
Support Zone: 0.36 – 0.37 (highlighted in light grey below the entry).
Price has tested this area and bounced.
Resistance Zone: 0.42 – 0.43 (upper target).
This is where price may stall or reverse.
✅ In summary:
This is a long trade setup on ARKM/USDT, where the trader enters at ~0.386, sets a stop loss below 0.358 (to protect from breakdowns), and targets 0.427. The idea is that the support at 0.36–0.37 will hold and push the price back toward resistance near 0.42+.

ARKM/USDT — Major Reversal Incoming or Final Breakdown?Overview
ARKM is now trading at its most critical level since the explosive rally of 2024.
The latest 5D candle shows a sharp drop followed by a long lower wick, briefly breaking below the $0.375–$0.280 support zone before rebounding — a classic sign of a liquidity sweep and potential buyer absorption at a major demand area.
This yellow zone represents the “last line of defense” for bulls.
If the price holds, a medium-to-long-term reversal could be forming.
However, if this zone breaks with a decisive close below $0.280, ARKM may enter a capitulation phase, signaling further downside risk.
---
Structure & Price Pattern
Since the 2024 peak near $3.996, ARKM has formed a series of lower highs and lower lows, confirming a mid-term downtrend.
Price is currently hovering around the major accumulation base ($0.375–$0.280), the same area that once launched its previous rally.
The long lower wick signals stop-hunting and liquidity collection below key support — often a precursor to reversal when followed by buyer strength.
If price sustains above this zone and starts forming higher lows, a trend reversal could be confirmed.
---
Key Technical Levels
Major Support (yellow zone): $0.375 – $0.280
Next Resistances: $0.616 → $0.730 → $0.894
Major Upside Targets: $1.575 → $2.493 → $3.188
All-Time High: $3.996
Extreme Wick Low (liquidity sweep): $0.050
---
Bullish Scenario
If ARKM holds and closes above $0.375, the $0.280–$0.375 zone could act as a strong demand base.
A clear break and close above $0.616 would confirm the start of a potential trend reversal.
With increasing volume and momentum, targets at $0.894 – $1.575 become achievable.
Bullish Confirmation Signals:
5D candle close above $0.375 with strong rejection wicks below.
Break and close above $0.616 with rising volume.
Structure shift to higher lows.
Bullish Targets:
$0.616 → $0.894 → $1.575 → $2.493
---
Bearish Scenario
If the price breaks below $0.280 and closes beneath it, bearish momentum will likely intensify.
This would indicate that bulls have lost control, opening the door to a deeper correction toward $0.20 – $0.10, or even $0.05 in an extreme capitulation event.
In that case, the $0.375–$0.280 zone could flip into new resistance.
Bearish Confirmation Signals:
5D candle close below $0.280 with no strong rebound.
Failed retest of $0.280–$0.375 as resistance.
Volume spike on sell-side pressure.
Bearish Targets:
$0.20 → $0.10 → $0.05
---
Market Psychology
ARKM’s recent movement perfectly illustrates fear vs. opportunity in the market cycle.
While retail traders panic-sold during the wick breakdown, smart money often takes advantage of such extreme liquidity sweeps to accumulate at discounted levels.
The liquidity flush below $0.280 suggests that weak hands have been shaken out, potentially paving the way for a new impulsive move — whether up or down will depend on how price reacts in the next few candles.
---
Conclusion
The $0.375–$0.280 zone is ARKM’s make-or-break level.
A strong defense here could trigger a large-scale reversal, while a confirmed breakdown would mark the start of another deep correction.
Traders should:
Wait for clear confirmation (breakout or breakdown).
Apply strict risk management due to high volatility.
Focus on volume and candle structure around this zone to gauge market intent.
---
#ARKM #ARKMUSDT #CryptoAnalysis #SupportZone #LiquiditySweep #CryptoTrading #TechnicalAnalysis #MarketStructure #ReversalZone #SmartMoneyConcepts #CryptoMarket #SwingTrade

Arkm's price may drop more and more.Arkm may provide a good opportunity for long-term buying in the coming months. Most likely in the autumn months.
* The purpose of my graphic drawings is purely educational.
* What i write here is not an investment advice. Please do your own research before investing in any asset.
* Never take my personal opinions as investment advice, you may lose your money.

I am Bullish on ARKMUSDTAfter a critical analysis, I have come to a conclusion that #Arkmusdt is approaching a very key zone where buying will be a good idea. I believe as BTC retrace to a key zone to wipe unmitigated zone these pairs could do the same.

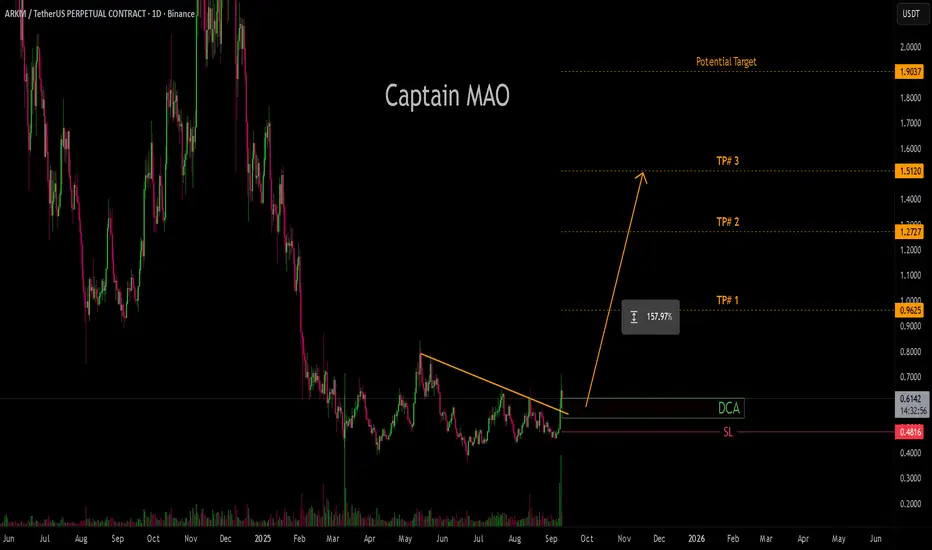
BUFFALO | $ARKM is going goodOverall, the monthly timeframe of ARKM is showing a clear compression phase, characterized by large-volume doji candles — a sign that strong accumulation is taking place at current levels. After an extended downtrend, the current price structure indicates that selling pressure is weakening, while buying interest is gradually stepping in around key support zones. From a technical standpoint, this is shaping up to be a solid base-building phase, potentially setting the stage for a new bullish cycle once broader market conditions stabilize.
I’ll be keeping a close watch on ARKM in the coming weeks, as a clean breakout from this consolidation range could offer a significant trading opportunity. My plan is to enter around 0.55x, with DCA entries down to 0.4 if further retracement occurs. The target levels are set sequentially at 0.82, 1.00, 1.18, 1.38, 1.78, and 2.39, aligning with major technical resistance zones and potential profit-taking areas along the upward trajectory. Overall, ARKM remains one of the coins I’m watching most closely for the upcoming quarter.
Swing Trading Plan:
Entry: 0.55x - 0.4
SL: 0.3
Tp: 0.8 - 1.1 - 1.3 - 1.75
Drop a comment here if you have the same opinion :)

ARKM 1H AnalysisHere is an analysis of ARKM on 1 Hour time frame. ARKM key buying area and expected targets are given on chart. DYOR NFA

Perp-Dex Trend Is Heating Up — Are You In?
A clear wave of interest is forming around decentralized perpetual exchanges. This isn't just noise price action across multiple tokens confirms the trend.
🔸 #MYX early mover, rapidly climbed into the top-50
🔸 #AVNT (Coinbase) validated the narrative
🔸 #Aster (backed by CZ) kept the momentum strong
🔸 #APEX (Bybit) latest high-volume breakout
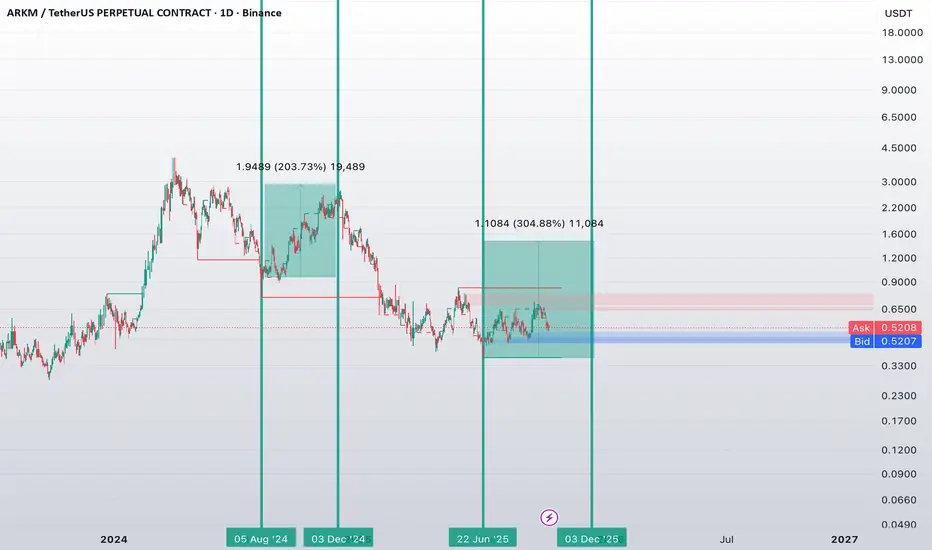
📌 But One Name Deserves Special Attention ARKM
ARKM is more than a Perp-DEX.
It features a powerful on-chain analytics layer, allowing real-time tracking of smart money movements, trader behavior, and liquidity flows.
The chart shows two key moves:
🚀 +200%
🚀 +300%
Now the price is consolidating in a strong demand zone historically a setup for the next leg up.
🎯 The team is preparing Season 2 rewards, so this might be the best time to test the platform and position ahead of the crowd.
If you're active in perp trading, don’t sleep on ARKM. This project could be a standout in the evolving DEX landscape.
💬 Share your thoughts:
– Have you traded on Arkm?
– How do you see the future of Perp-Dexes?
– Ready to ditch CEXes for fully on-chain platforms?
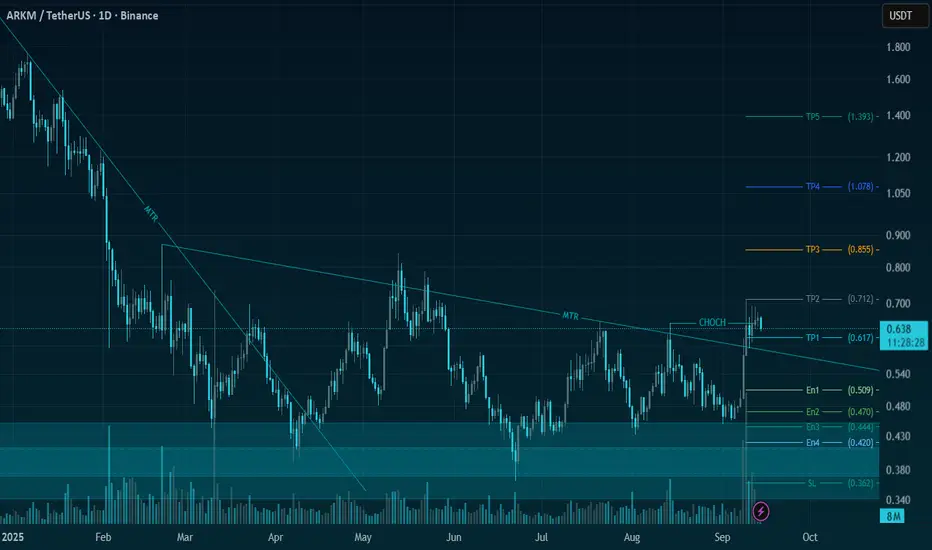
ARKM/USDT | Low-Risk Swing Setup with 200%+ Upside Potential🚀 Trade Setup Details:
🕯 #ARKM/USDT 🔼 Buy | Long 🔼
⌛️ TimeFrame: 1D
--------------------
🛡 Risk Management (Example):
🛡 Based on $10,000 Balance
🛡 Loss-Limit: 1% (Conservative)
🛡 The Signal Margin: $476.64
--------------------
☄️ En1: 0.5091 (Amount: $47.66)
☄️ En2: 0.4703 (Amount: $166.82)
☄️ En3: 0.4446 (Amount: $214.49)
☄️ En4: 0.4202 (Amount: $47.66)
--------------------
☄️ If All Entries Are Activated, Then:
☄️ Average.En: 0.4576 ($476.64)
--------------------
☑️ TP1: 0.6168 (+34.79%) (RR:1.66)
☑️ TP2: 0.712 (+55.59%) (RR:2.65)
☑️ TP3: 0.8545 (+86.74%) (RR:4.13)
☑️ TP4: 1.0778 (+135.53%) (RR:6.46)
☑️ TP5: 1.3927 (+204.35%) (RR:9.74)
☑️ TP6: Open 🔝
--------------------
❌ SL: 0.3616 (-20.98%) (-$100)
--------------------
💯 Maximum.Lev: 3X
⌛️ Trading Type: Swing Trading
‼️ Signal Risk: 🙂 Low-Risk! 🙂
--------------------
🔗 www.tradingview.com
❤️ Your Likes & Comments are valuable to us ❤️
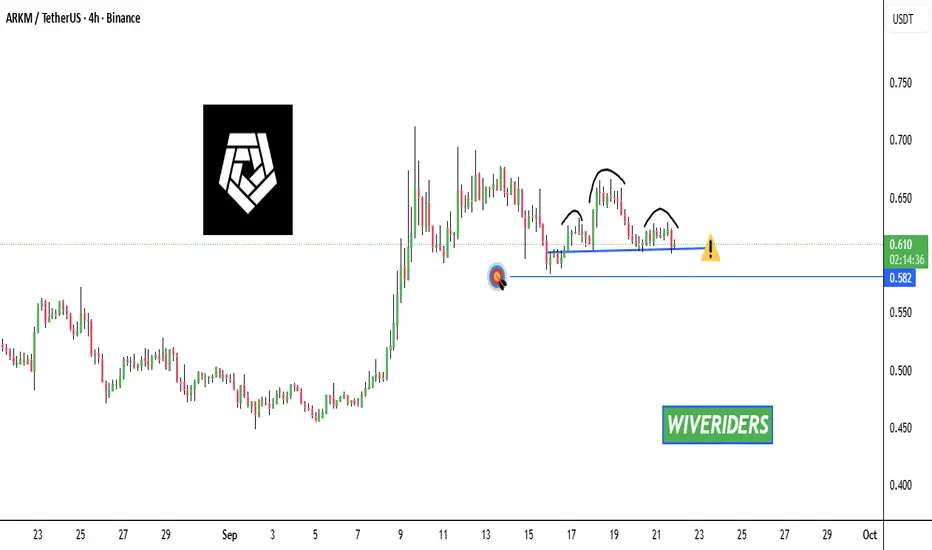
ARKM is forming a bearish head and shoulders pattern📊 $ARKM Market Update
$ARKM is forming a bearish head and shoulders pattern 🔻. If it breaks below the blue support line 🔵, the first target will be the 🟢 green line level 🎯.

ARM - BULLISH OUTLOOK$ARKM might be ready to take off soon! 🚀
As long as it holds above the $0.580 – $0.570 zone, this setup looks solid. Keeping my eyes on it! 👀

MNT already moved. Will ARKM follow next?📊 MNT already moved. Will ARKM follow next?
For over a year, I’ve mostly focused on two tokens I truly believed in:
TSX:MNT and $ARKM
MNT has already delivered a solid move and validated the setup we tracked for months.
But now the spotlight is shifting to ARKM.
💡 What I’m seeing:
– Clean rounded bottom structure
– Breakout zone around $0.75
– Upside target: $2.20+ (over +330% potential)
– History shows: ARKM has done it before
If volume kicks in and the breakout confirms, this could be one of the most asymmetric setups on the market.
Not financial advice — but I’m watching ARKM closely.

ARKM - READY TO FLY!!! $ARKM - big moonshot incoming?? 🚀🚀🚀
✅Clean retest of the daily wedge
✅Double bottom daily
✅Previous breakout with huge volume
Im in, price looks ready to explode way more! 📈📈📈

ARKM Q4 OutlookForecasting a generally less than spectacular alt-season.
$ARKM recently saw it's largest buying-volume since march 2025, and one other time february 2024, which preceeded a significant price rally.
Targets are muted. No new highs anticipated.
Rally expected to last 30-60 days in Q4 before a massive correction.

ARKM/USDT - Trend reversal delivered a powerful and clean breakout, supported by strong buying volume that confirms a clear trend reversal. This momentum shift signals growing confidence among buyers, with structure favoring further upside.
Current levels inside the green box offer a solid DCA zone, giving traders the opportunity to position early for the upcoming targets as the new bullish leg unfolds.
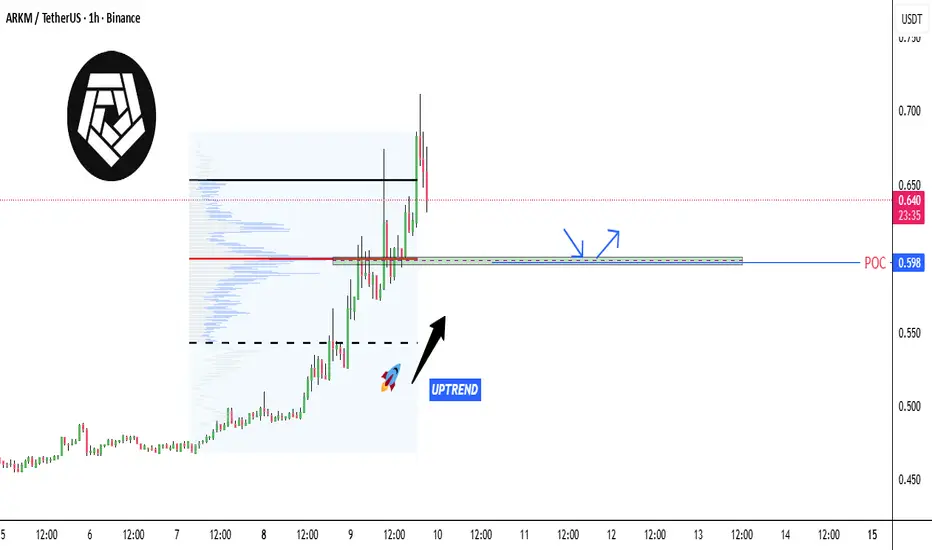
ARKM Trading Update
$ARKM Trading Update
$ARKM is now retracing after the recent move. If the price continues lower into the green support zone, this area could provide a potential long entry.
The zone aligns with the POC and strong buyer accumulation, where bulls previously stepped in and defended their positions. A bounce from here could restart the uptrend — but waiting for confirmation before entering long is essential.
(POC + accumulation cluster) remain the main reasons to watch this level closely.
Happy trading ✨
Just a matter of some time and #ARKM will UP 90 %
It’s just a matter of some time and #ARKM will give more than 90% return. I had also done an earlier analysis of #ARKM, which was on a long time frame. That trade is also running in profit. That analysis is also attached in the post.
^ Jai Shree Ram ^
* Namaste *

ARKM ANALYSIS🔮#ARKM Analysis 💰💰
#ARKM is trading in a symmetrical triangle in a weekly time frame and breakouts with high volume and we could see a bullish momentum in #ARKM. Before that we will see little bit retest and then bullish movement
🔖 Current Price: $0.595
⏳ Target Price: $0.791
⁉️ What to do?
- We can trade according to the chart and make some profits in #ARKM. Keep your eyes on the chart, observe trading volume and stay accustom to market moves.💲💲
🏷Remember, the crypto market is dynamic in nature and changes rapidly, so always use stop loss and take proper knowledge before investments.
#ARKM #Cryptocurrency #Pump #DYOR

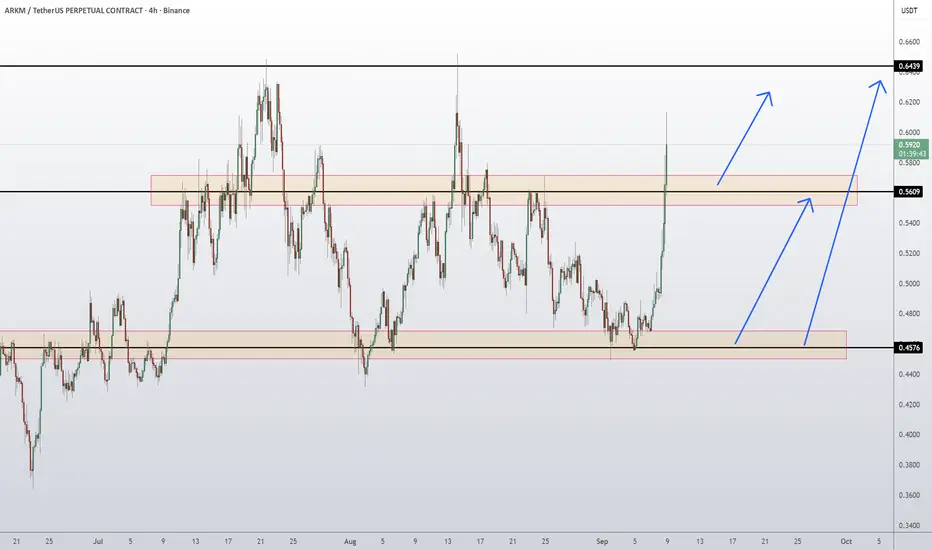
ARKM Coin Arkham Token Price Prediction and Technical AnalysisARKM/USDT has broken out strongly from the 0.4576 demand zone, rallying with momentum and reclaiming the 0.5609 resistance-turned-support. This breakout confirms bullish strength, and if buyers hold above 0.5609, continuation toward the next key resistance at 0.6439 looks probable. In case of a pullback, a healthy retest of 0.5609 would provide an opportunity for buyers, while losing this level could send price back toward 0.4576 demand before another leg higher.
📈 Key Levels:
Buy trigger: Retest/hold above 0.5609 support
Buy zone : 0.5609 – 0.58 region
Target: 0.6439 resistance
Invalidation: Daily close below 0.4576 (would weaken bullish outlook)
👉 Follow me for More Real Time Opportunities.
Share your Thoughts if you have any?