POT AR LONG 22.12.2025Pinning after abnormal activity.
💰I enter at the market price.
I'll let you know when I record it manually.
‼️Risk per trade: 1% of the allocated funds for spot trading.
Market insights

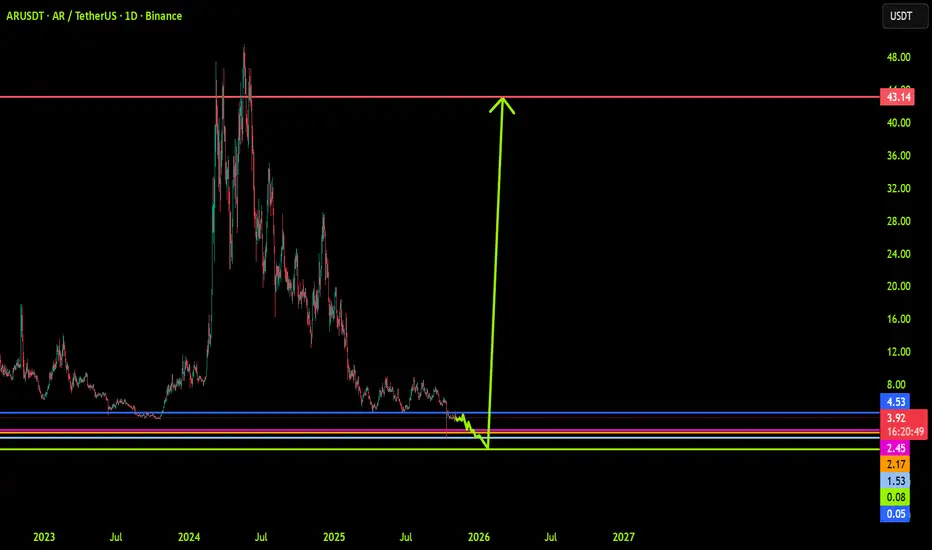
Price Back at Key Historical Low...High R:R SetupTaking a close look at AR/USDT on the daily timeframe. Price has completed a deep correction following its massive bull run and has now returned to a major historical support level.
This area acted as a base for the previous move and is clearly a significant pivot point. We've recently seen a sharp "stop hunt" (as labeled) underneath this support zone, which often precedes a reversal if the level holds.
Entry: Look for confirmation of a bounce/holding above the major support level (around $3.00 - $3.50).
Stop Loss: A clean daily close significantly below the support zone and the stop hunt low (e.g., below $2.50).
Potential Targets:
T1: $9.55
T2: $12.55
T3: $16
T4: $23.86
This setup offers a potentially attractive Risk/Reward ratio if the historical support proves strong once again. Trade with caution, always manage your risk, and wait for confirmation!
Good Luck!
#AR #ARUSDT #Crypto #Support #TechnicalAnalysis

ARUSDT - WAVESBINANCE:ARUSDT
Price is still inside an A-B-C correction.
Wave C isn’t confirmed finished yet, but momentum is slowing and price reacted well from the channel low.
A break above the C-pivot high would be the first signal of a possible Wave 1 of (3).
The setup stays valid as long as price holds above 3.53.
- This is not financial advice.

Nothing can stop this, Arweave is going for 500$Just buy this bottom range and leave it be.
This project is permanently defining the future.
Nothing can change the Arweave 500$ happening.

Will ARUSDT's Hidden Liquidity Grab Spark a Major Bullish Move?Yello, Paradisers — are you watching ARUSDT closely? Because this setup could develop into one of the cleanest short-term opportunities we’ve seen lately, but only for those who remain patient and calculated. The current structure is showing early signs of a potential bullish shift, and here’s what we’re seeing.
💎ARUSDT has displayed a proper bullish Change of Character (CHoCH) along with a Break of Structure (BOS), both occurring right after a clean sweep of seller-side liquidity. This kind of price action generally signals a potential reversal and significantly increases the probability of a short-term bullish continuation.
💎However, while the bias is clearly tilting bullish, jumping in at current price levels doesn't offer an optimal risk-to-reward setup. Entering now would only give about a 1:1 RR, which isn’t ideal for high-probability trading. The more strategic move would be to wait for a retracement back into the Fair Value Gap (FVG). If price pulls back into that zone and forms a clear bullish candlestick pattern, the probability of a strong move upward increases substantially, and the RR improves in our favor.
💎That said, the setup isn't without its invalidation. If ARUSDT breaks down and we get a candle close below the invalidation level, the entire bullish scenario becomes invalid. In that case, there’s no reason to force a trade. It’s smarter to stay patient and wait for a clearer structure to reappear.
🎖Strive for consistency, not quick profits. Treat the market as a businessman, not as a gambler. There will always be another opportunity, but only if you protect your capital and remain disciplined. Stay focused and let the setup come to you — not the other way around.
MyCryptoParadise
iFeel the success🌴

ARUSDT Gearing Up for a Powerful Wave 3 LaunhARUSDT has completed its corrective phase via a well defined ending diagonal, followed by a strong impulsive move completing wave 1. Price recently tested a significant supply zone, leading to a sharp retracement toward $4.48, aligning with the previous bottom structure.
This zone is projected to form the immediate base, and our plan is to accumulate within this range, targeting the anticipated wave iii, historically known as the strongest and most extended move in the Elliott Wave sequence.
The entry plan and potential targets are clearly outlined on the chart. Feel free to share your view.

Arweave – The Forgotten Web3 Infrastructure Gem Arweave – The Forgotten Web3 Infrastructure Gem 🌐🧠
ARUSDT just bounced from a brutal multi-year base near $5 — but this isn’t just another altcoin.
Arweave powers the permanent web. A decentralized data layer where information lives forever — not 30 days, not 30 years. Forever. It’s Bitcoin for storage, backed by the MIT License (2025) and built for one mission: data immortality .
What’s wild? Major chains and dApps already use it to store:
NFT metadata
On-chain governance archives
Front-ends for fully decentralized apps
📊 Chartwise:
$5.42 current
$16.98 first key resistance
$45.44 → $71.07 → $113.53 are the next Fibonacci zones if this cycle fully rotates
The rabbit hole is deep. But if the internet ever truly decentralizes, Arweave will be the hard drive it lives on.
Perspective Shift 🔄
Most people chase tokens that “do something.” Arweave stores the entire narrative. And in a digital world, storage is everything.
Disclaimer: I’m just sharing wisdom, not instructions. No licenses, no guarantees — just years of trading scars and precision chartwork. Be smart, protect your capital, and don’t copy blindly.
One Love,
The FXPROFESSOR 💙

AR WILL FLY LIKE ICPStorage coins bullish, DATA + STORAGE + CLOUD + AI + MASSIVE POTENTIAL. Use proper risk management

ARUsdtAr can break this resistance line can great pump i set close entry point to patient entrypoint hti s abouturstrategy and risk for picl one of them
GL
EntryPoint:
5.7640
5.4106
4.9016
Resistance:
6.7343
Taargets:
8.1886
9.0750
10.5257
MidtimE or Long term:
13.8723
16.9863
21.4030
28.6190
GL

You buy not for tomorrow, but for next year.Bottoming in progress.
Very low circulation and mined - Arweave likes to move very quickly and steeply.
Volume increasing.
Mass sell event.
Trend turnaround incoming.
Once Zec and Dash are done money will flow elsewhere.

ARUSDT: trend in daily time framesThe color levels are very accurate levels of support and resistance in different time frames, and we have to wait for their reaction in these areas.
So, Please pay special attention to the very accurate trend, colored levels, and you must know that SETUP is very very ... very sensitive.
Don't get the short position, just if price down to sensitive area get the BUY position.
So, please set the order for BUY position with +200 pips SL.
Be careful
BEST
MT
$AR looking solid on the 4H chart After a major pullback, NYSE:AR has made a strong comeback — forming a bullish setup while building solid support around the $4 zone.If hold above $4.2, we could see a strong upside move next! 🚀
🎯 Targets: $4.5 – $4.7 – $5.0
🔸 Support: $4.00 and $3.75
🔸 Resistance: $4.60 and $4.85
📊 Trend: Bullish momentum building up

ARUSDT Forming Falling WedgeARUSDT is currently forming a strong falling wedge pattern, a bullish reversal setup that often signals the end of a downtrend and the beginning of a potential rally. The price structure shows contracting lower highs and lower lows, creating a tightening range that suggests selling pressure is fading while buyers are gradually stepping in. This consolidation phase could soon give way to a breakout, marking a possible shift in market sentiment toward the upside.
The trading volume for ARUSDT remains healthy, which supports the idea of accumulation within the wedge formation. As volume typically expands during breakout phases, traders are watching this pair closely for confirmation of an upward move. Based on the technical outlook, ARUSDT holds potential for a strong rebound, with expectations of gains ranging between 140% to 150% once the breakout is confirmed.
Investor confidence in the project continues to grow, as ARUSDT gains more attention from traders looking for high-upside opportunities in the current market cycle. The confluence of strong technical signals, consistent volume, and rising interest indicates that momentum could soon favor the bulls. A decisive close above the wedge resistance may trigger a surge toward higher price targets in the coming sessions.
✅ Show your support by hitting the like button and
✅ Leaving a comment below! (What is You opinion about this Coin)
Your feedback and engagement keep me inspired to share more insightful market analysis with you!

ARUSDT 1D#AR is currently trading within a falling wedge pattern on the daily chart. For the bullish scenario to remain valid, the price must hold above the support zone. If a breakout occurs above the wedge resistance, the potential upside targets are:
🎯 $5.85
🎯 $7.12
🎯 $8.16
🎯 $9.19
🎯 $10.65
🎯 $12.52
⚠️ Always use a tight stop-loss and maintain proper risk management.

Arweave shortEntry now: 3.94, with optional scale‑in on a pop that stalls around 4.04–4.10.
Primary targets: 3.72, then 3.55, then 3.35; take partials at each step.
Hourly setup (loose): stop above 4.28 or Entry + 2×ATR(1h); trail by ~1×ATR after first target.
4‑hour setup (loose): stop above 4.45 or Entry + 2.5×ATR(4h); add only if a bounce into 4.28–4.45 rejects.
Daily setup (loose): stop above 4.45 or Entry + 3×ATR(1d); bias remains bearish while short MA stays beneath long MA.
Weekly context: use very small size; catastrophic stop above the long MA region near 6.44–6.60 if holding for weeks.
Invalidation cue: sustained daily close back above ~4.28 weakens the short thesis; reduce or exit.
Risk control: risk 1–2% per trade and size via position‑sizing formula based on distance to stop for capital protection.

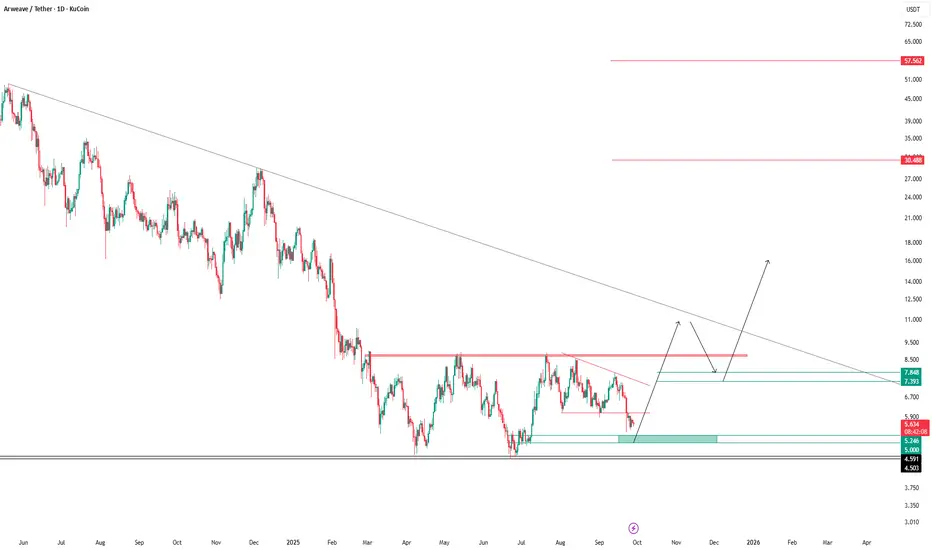
AR/USDT — Major Reversal or the Start of Breakdown?ARWEAVE (AR/USDT) is now standing on the edge of its most critical support zone between $4.4–$3.7 (highlighted in yellow).
This zone has acted as a major historical demand area since 2023 — the last stronghold where institutional accumulation often takes place.
But this time, the market has shown something different:
A deep wick below $3.7 indicates a massive liquidity grab, suggesting that the market might have flushed out weak long positions and stop orders before deciding its next major move.
---
Technical Structure & Pattern
Macro trend: Still in a structural downtrend since early 2024 (lower highs and lower lows).
Key support zone: $4.4–$3.7 remains a major reaction area that has repeatedly absorbed selling pressure.
The long wick below support suggests a potential fake breakdown or bear trap, especially if price reclaims $4.4–$6.0 in the next few candles.
Failure to hold above $3.7 would confirm a bearish continuation pattern and shift market sentiment further downward.
---
Bullish Scenario
📈 Accumulation Reversal Setup
If price successfully holds above $4.4–$3.7 and manages to close above $6.075, it could mark the beginning of a mid-term reversal.
This setup is often accompanied by strong volume spikes, bullish engulfing candles, and a new higher low formation above the support.
🎯 Upside Targets:
Target 1: $8.395 — first major resistance and reaction zone.
Target 2: $10.882 — key breakout confirmation level.
Long-term targets: $26.989 and $47.674, if the macro reversal strengthens into a new bullish cycle.
This could become the foundation of a re-accumulation phase, similar to previous cycle bottoms.
---
Bearish Scenario
📉 Final Breakdown and Capitulation Risk
If the price closes a 5D candle below $3.7 and fails to reclaim the zone, it would confirm that the yellow block has turned into a new resistance area.
This would signal a final distribution phase before potential capitulation.
🎯 Downside Targets:
Target 1: $3.0 — next psychological and structural support.
Target 2: $2.4 — historical low based on previous liquidity sweep.
A confirmed breakdown below this zone could trigger capitulation, flushing out remaining long positions before the next accumulation cycle begins.
---
Conclusion
ARWEAVE is currently at a make-or-break zone ($4.4–$3.7) that will define its medium-term direction.
If buyers defend this level, the market could form a strong base for a major reversal.
However, if the support gives way, AR might revisit $3.0–$2.4 before finding a true bottom.
This zone represents a high-stakes battle between bulls and bears —
and the next few candles will decide whether we’re witnessing the birth of a new uptrend, or the continuation of the final downtrend leg.
---
#ARWEAVE #ARUSDT #CryptoAnalysis #TechnicalAnalysis #PriceAction #SupportZone #LiquidityGrab #MarketStructure #AltcoinAnalysis #CryptoTrading #DecisionZone #SwingTrade

AR 1..4(2.4) -> 16..32(24)Ok, until no one had published any intelligent idea, i will do some insight for you.
AR itself is probably the best coin to hold. Decentralized storage is in fact the blood of web3 world, but 99% of people/projects ignore it and spam zillions of useless PoW/PoS/etc... coin clones. Arweave is a network with good technology proven by years. Next, 65.65M of 66M tokens are issued. It has strong demand in the market. Last cycle it had bottom at 4 and top at 64. Thats legit because during last cycle BTC risen from 16k to 128k - 8 times, alts has x2 bonus to BTC movement. Now BTC is in the expected fall from 128k to 32k, like during the preceding cycle it fell from the 64k levels to 16k - 4 times. This means, that regular alts fell 8 times. Likewise, AR fell from 32..64 price range (48) down to 4 (2...6) price range. AR peaks are going in a row 96,48,... and next expected top could be at 24, which is obvious by looking at vertical volumes profile. And it lies in 16..32 price range. So, given that good alts pump about x10, low prices range should be 1...2.4...4.
So, best price to buy is/was 2.4, best price to sell will be 24, probably, because real market intentions are yet unknown, and it is a very volatile market with low liquidity, which rises risks, but also allows to get higher profits.

AR (Arweave) - Major Support Zone In PlayAR has seen a sharp pullback over the last few weeks and is now testing a key support level. This zone has previously acted as a strong base, making it a potential area for bullish reversal or bounce.
💡 Trade Idea:
🔹 Entry Zone: $5.20 – $5.40
🔹 Targets (TP):
• First target: $6.10 – $6.60
• Second target: $7.80 – $8.75
🔹 Stop Loss: Just below $5.00
🔍 Watch for bullish confirmation (volume spike, candle reversal) at support before entering. Manage your risk and scale out at key resistance levels.

AR Looks Bullish (1D)The AR symbol appears to be completing a double corrective pattern | the first part being a plapyonic diametric and the second part a flat. The green zone represents a demand area that could potentially push the price upward. Note that this type of setup is generally safer for spot trading, while futures trading would require more precise entry levels.
Targets are marked on the chart.
A daily candle closing below the invalidation level will invalidate this analysis.
For risk management, please don't forget stop loss and capital management
Comment if you have any questions
Thank You

54% Spot Profit ARUSDT / Arweave coinEntry Point : 5.248
Partial-exit : 5.884
Take Profit: 6.65
Stop-Loss : 4.89
A partial exit in the range of 30% to 50% is under consideration and make it free.

AR – Testing Support, Eyeing Higher Targets
AR is currently trading around $5.630, consolidating above a key support zone near $5.240. Price action shows a downtrend line pressing from above, but buyers continue to defend the blue support area.
- Support: $5.240 – $5.000
- Bullish case: A breakout above $8.700 could open the way toward $30
⚖️ AR is at a pivotal level — holding support could fuel a strong rally, but traders should wait for confirmation above resistance before positioning aggressively.
$ARUSDT is on the path for a bullish runHere my idea of #AR, it is following perfectly the bullish path so far, staying on the support. The next goal is around $7.5. Will it break the resistance there and fly up?

$AR long trade worked out well like others.NYSE:AR pumped crazy 20% profits if you listened to my entry and did not get shaken out then congrats on profits. Taking partial profits here. Will look to scale the position later next week.
