ATAFWB:ATA has been in accumulation for over 1200 days, showing consistent support and compression. The R:R setup here looks excellent, offering a solid opportunity for patient traders waiting for the next breakout phase.

ATA/USDT — Historical Support: Major Accumulation or Breakdown?Overview:
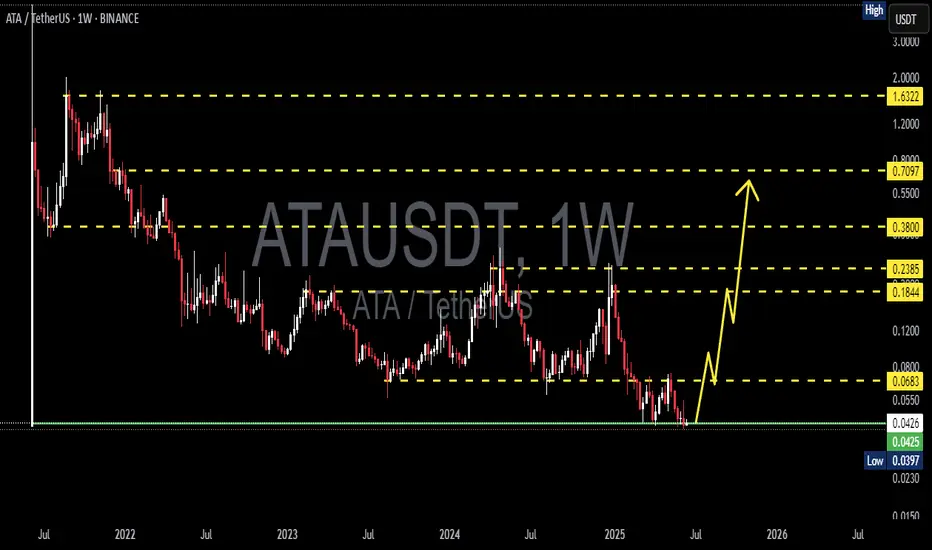
ATA/USDT has been in a long-term downtrend since 2021, consistently printing lower highs as selling pressure dominates. However, the market is now showing signs of a critical consolidation phase around the historical support zone at 0.028 – 0.044 (yellow box). This area has acted as a majo

ATAUSDT 1W AnalysisATA ~ 1W Analysis
#ATA This is the lowest price at the launch of this coin. Buy if you are ready to take the risk in this trade. Short term target is at least 15%+.
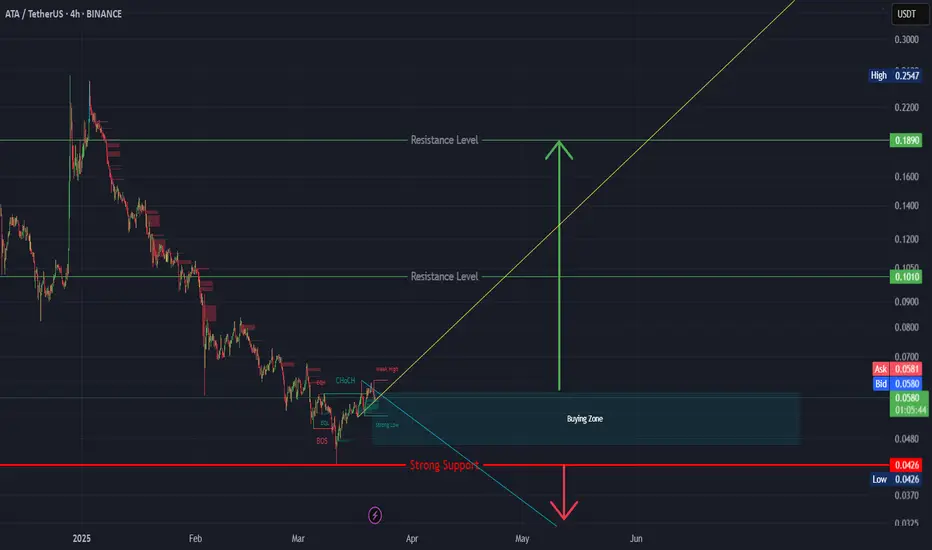
ATAUSDT 1D Analysis ATA ~ 1D Analysis
#ATA Buy after successfully breaking this resistance line or buy when retesting this support block with a short-term target of at least 10%++.

ATAUSDT 1WATA ~ 1W Analysis
#ATA This trade is very high risk. Buy from here with a short -term target of at least 15%+. This is the lowest support for now.

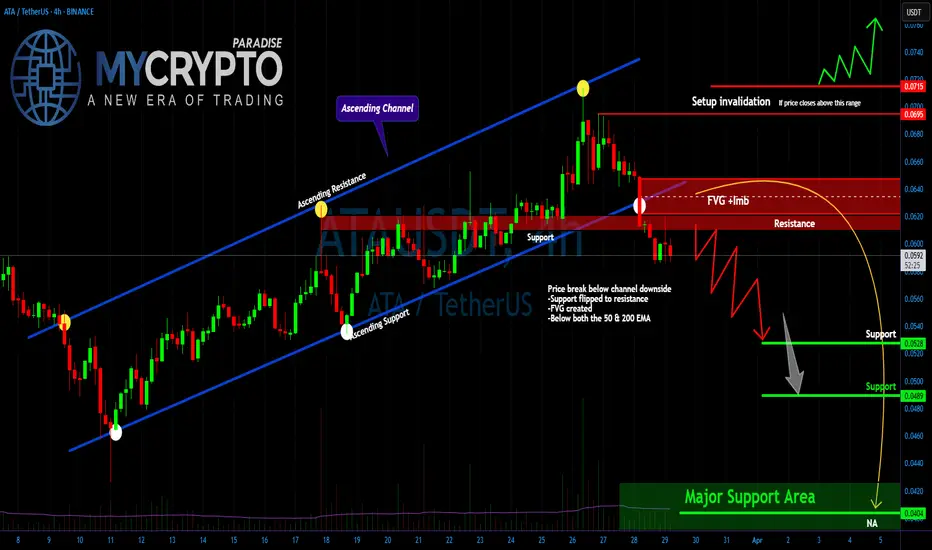
Major Breakdown Confirmed! Is a Bigger Dump Incoming? Yello, Paradisers! Did you catch this critical shift in price action? A major breakdown has occurred, flipping previous support into resistance and confirming a trend reversal from bullish to bearish. This shift has reinforced selling pressure, with price now trading below both the 50 & 200 EMA, sig
ATA ( SPOT )BINANCE:ATAUSDT
ATA / USDT
4H time frame
analysis tools
____________
SMC
FVG
Trend lines
Fibonacci
Support & resistance
MACD Cross
EMA Cross
______________________________________________________________
Golden Advices.
********************
* Please calculate your losses before any entry.
* D
ATAUSDT 1WATA ~ 1W Analysis
#ATA Buy gradually from here if you still have a Conviction on this Coin.
This is the lowest price at the time of this coin launch.

ATAUSDT 1WATA ~ 1W Analysis
#ATA This is the lowest support for now, you can buy gradually from here with a minimum target of 20%+


See all ideas
Summarizing what the indicators are suggesting.
Oscillators
Neutral
SellBuy
Strong sellStrong buy
Strong sellSellNeutralBuyStrong buy
Oscillators
Neutral
SellBuy
Strong sellStrong buy
Strong sellSellNeutralBuyStrong buy
Summary
Neutral
SellBuy
Strong sellStrong buy
Strong sellSellNeutralBuyStrong buy
Summary
Neutral
SellBuy
Strong sellStrong buy
Strong sellSellNeutralBuyStrong buy
Summary
Neutral
SellBuy
Strong sellStrong buy
Strong sellSellNeutralBuyStrong buy
Moving Averages
Neutral
SellBuy
Strong sellStrong buy
Strong sellSellNeutralBuyStrong buy
Moving Averages
Neutral
SellBuy
Strong sellStrong buy
Strong sellSellNeutralBuyStrong buy
Displays a symbol's price movements over previous years to identify recurring trends.