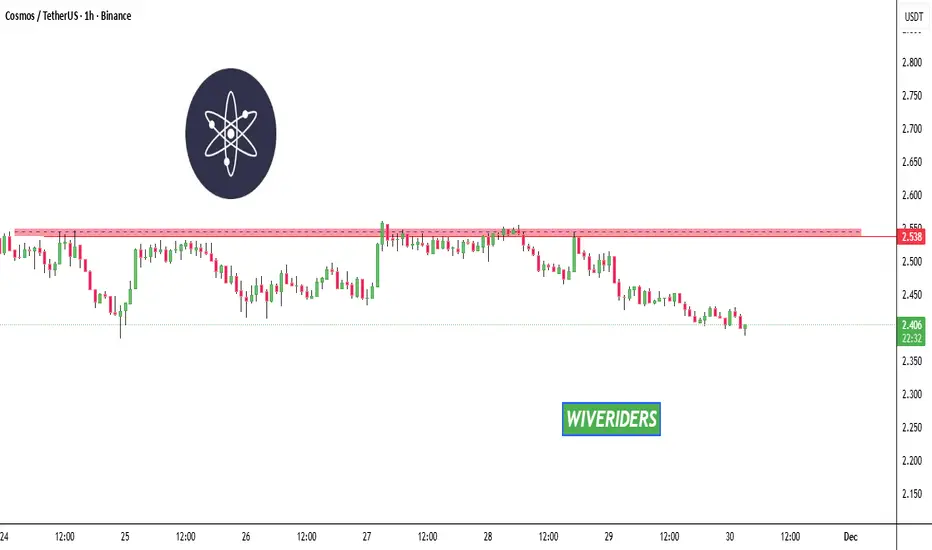
Cosmos (ATOM): Looking For Break of Bollinger Bands Middle LineATOM is still trading inside this slow bleed, but the last reaction from the smaller support shows buyers are trying to hold the zone. We already saw one pickup from this level, meaning this area stays the key region for any bullish attempt.
For upside, we need a proper structure break first. Price
Related pairs

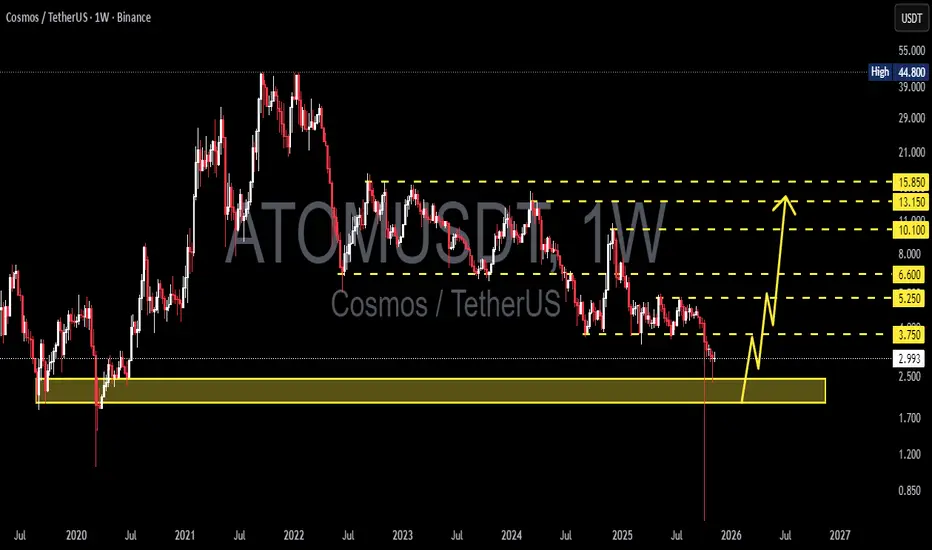
ATOM Update🚨📊 ATOM Update
ATOM has also formed a new resistance zone in red 🔴.
This level is now acting as a strong ceiling,
and price must break out above this red resistance
to show any real bullish momentum again.
Until that breakout happens,
sellers remain in control and upside stays limited.
$ATOM 1H - Bull FlagNASDAQ:ATOM 1H Chart
Price is forming a clean bull flag right on top of the 15m FVG support zone.
A breakout above the flag resistance opens the path for the next leg up, targeting a strong +3% move.
#COSMOS #ATOM

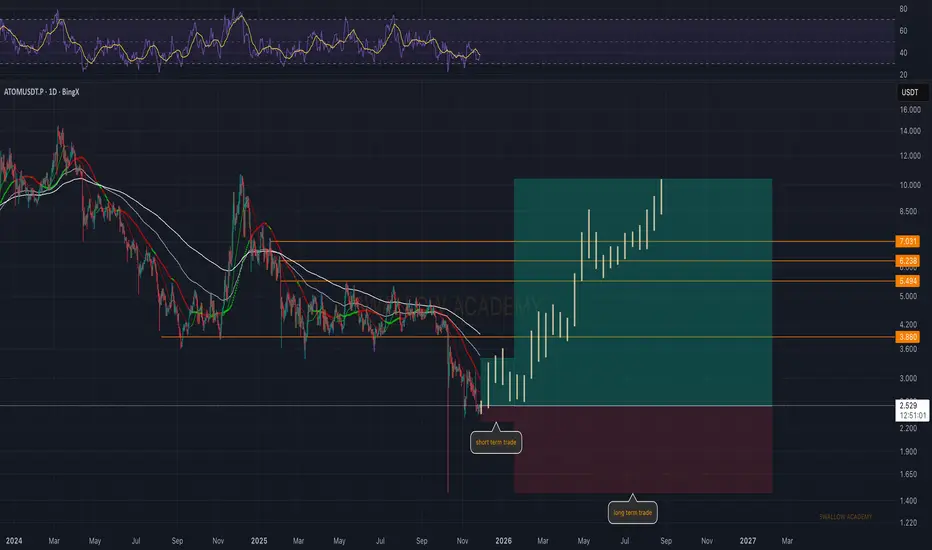
Cosmos (ATOM): Looking For Buy Entry | Long-Term + Short TermATOM is finally showing signs of a reversal after that long downside stretch, and with this reaction we already have a short-term trading opportunity forming. For the long-term setup the idea stays the same, but we’d go with smaller leverage since the SL is naturally wider on higher-timeframe plays.
#ATOM/USDT | ATOMUSDT Preparing for a Potential Drop#ATOM
The price is moving in a descending channel on the 1-hour timeframe. It has reached the lower boundary and is heading towards breaking above it, with a retest of the upper boundary expected.
We have a downtrend on the RSI indicator, which has reached near the lower boundary, and an upward re

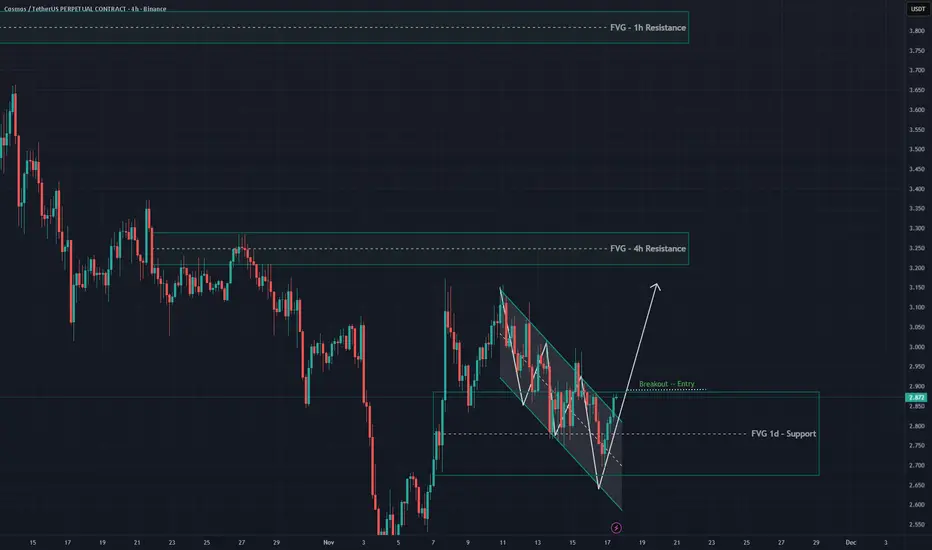
ATOMNASDAQ:ATOM on 4H is giving the first signals of a bullish reversal, breaking the framework of a Falling Channel and reacting strongly from the strong FVG 1D Support area $2.88.
With confirmation above the channel & breakout of FVG 1D $2.89, the nearest targets are $3.2–$3.25.
#ATOM #YodaXCalls
TradeCityPro | ATOMUSDT Preparing for a Potential Drop👋 Welcome to TradeCityPro!
Let’s dive into the analysis of ATOM, one of the older coins in the crypto market, which is currently sitting on a very critical support level — essentially its last major support zone.
🌐 Bitcoin Overview
Before we begin, let me remind you once again that at your request

Breaking: Cosmos ($ATOM) Spike 11% Today Albeit Market Dip The price of ( NASDAQ:ATOM ) soared 11% today despite the market bloodbirth that saw Ethereum tanked to $2900 zone and CRYPTOCAP:BTC to the $80k zone.
NASDAQ:ATOM is constricted in a tight symmetrical triangle pattern with the RSI at 53. Should the altcoin break the ceiling of the triangle to

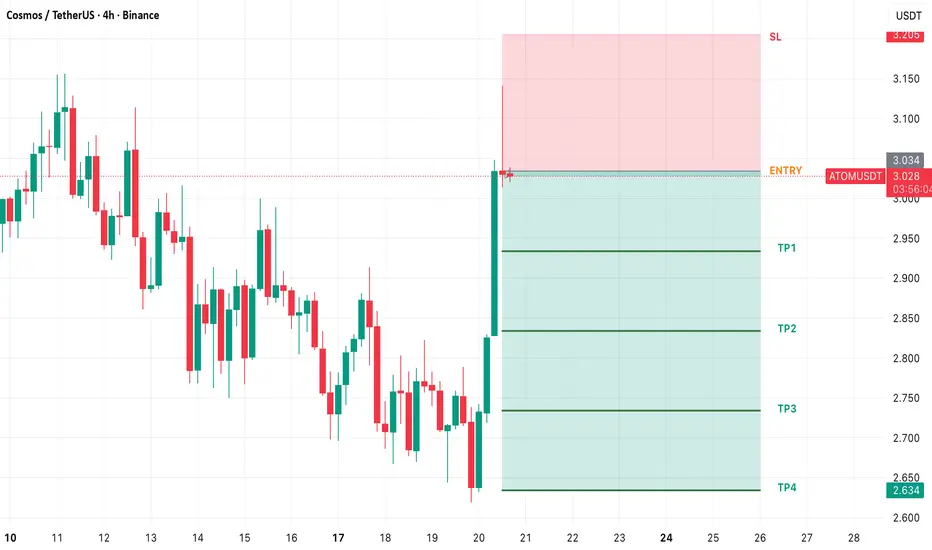
ATOM SHORT TRADE SETUPNew Trade Setup: ATOM-USDT
SHORT
Entry: 3.034 or CMP
Target: TP1: 2.934, TP2: 2.834, TP3: 2.734, TP4: 2.634
Stoploss: 3.205
Leverage: 1X
Technical Analysis: ATOM is currently facing strong selling pressure and is taking resistance. Its RSI is above 80 on the 4-hour timeframe, indicating overboug
ATOM/USDT — Diving into the Zone 2.4–1.9: Breakout or breakdown?Cosmos (ATOM) is now standing at its most critical point in recent years, precisely within the historical support zone of 2.45–1.95, which has served as a major accumulation area since the early phase of the 2020 bull run. This zone isn’t just a number—it represents the psychological foundation of A
See all ideas
Summarizing what the indicators are suggesting.
Oscillators
Neutral
SellBuy
Strong sellStrong buy
Strong sellSellNeutralBuyStrong buy
Oscillators
Neutral
SellBuy
Strong sellStrong buy
Strong sellSellNeutralBuyStrong buy
Summary
Neutral
SellBuy
Strong sellStrong buy
Strong sellSellNeutralBuyStrong buy
Summary
Neutral
SellBuy
Strong sellStrong buy
Strong sellSellNeutralBuyStrong buy
Summary
Neutral
SellBuy
Strong sellStrong buy
Strong sellSellNeutralBuyStrong buy
Moving Averages
Neutral
SellBuy
Strong sellStrong buy
Strong sellSellNeutralBuyStrong buy
Moving Averages
Neutral
SellBuy
Strong sellStrong buy
Strong sellSellNeutralBuyStrong buy
Displays a symbol's price movements over previous years to identify recurring trends.
Frequently Asked Questions
The current price of ATO / UST (ATOM) is 2.11110000 USDT — it has risen 1.37% in the past 24 hours. Try placing this info into the context by checking out what coins are also gaining and losing at the moment and seeing ATOM price chart.
ATO / UST price has fallen by −3.19% over the last week, its month performance shows a −24.01% decrease, and as for the last year, ATO / UST has decreased by −76.31%. See more dynamics on ATOM price chart.
Keep track of coins' changes with our Crypto Coins Heatmap.
Keep track of coins' changes with our Crypto Coins Heatmap.
ATO / UST (ATOM) reached its highest price on Sep 23, 2021 — it amounted to 46.77600000 USDT. Find more insights on the ATOM price chart.
See the list of crypto gainers and choose what best fits your strategy.
See the list of crypto gainers and choose what best fits your strategy.
ATO / UST (ATOM) reached the lowest price of 0.27614000 USDT on Oct 10, 2025. View more ATO / UST dynamics on the price chart.
See the list of crypto losers to find unexpected opportunities.
See the list of crypto losers to find unexpected opportunities.
The safest choice when buying ATOM is to go to a well-known crypto exchange. Some of the popular names are Binance, Coinbase, Kraken. But you'll have to find a reliable broker and create an account first. You can trade ATOM right from TradingView charts — just choose a broker and connect to your account.
Crypto markets are famous for their volatility, so one should study all the available stats before adding crypto assets to their portfolio. Very often it's technical analysis that comes in handy. We prepared technical ratings for ATO / UST (ATOM): today its technical analysis shows the sell signal, and according to the 1 week rating ATOM shows the sell signal. And you'd better dig deeper and study 1 month rating too — it's sell. Find inspiration in ATO / UST trading ideas and keep track of what's moving crypto markets with our crypto news feed.
ATO / UST (ATOM) is just as reliable as any other crypto asset — this corner of the world market is highly volatile. Today, for instance, ATO / UST is estimated as 1.27% volatile. The only thing it means is that you must prepare and examine all available information before making a decision. And if you're not sure about ATO / UST, you can find more inspiration in our curated watchlists.
You can discuss ATO / UST (ATOM) with other users in our public chats, Minds or in the comments to Ideas.