AVAAIUSDT CHART ANALYSİSHOW DO CRYPTO WALLETS WORK?
When someone sends Bitcoin, Ethereum, Dogecoin, or any other type
of digital currency to your crypto wallet, you are not actually
transferring any coins. What they are doing is signing off ownership
thereof to your wallet’s address. That is to say, they are confirming
t
Related pairs

AVA/USDT – Long-Term Bullish Reversal in PlayAVA has been trading within a well-defined downward channel for weeks, making consistent lower highs and lower lows. However, price has now broken above the upper boundary of the channel with strong volume and momentum, signaling a potential trend reversal.
Technical Analysis:
Channel Breakout:
P

AVAAIUSDT.P 4H SHORTPrice did a bearish trendline third touch and printed a strong bearish engulfing signal. Short position and at 0.03050 with stops at 0.03450. I expect a sell off to 0.02250.
What are your thoughts on this ?

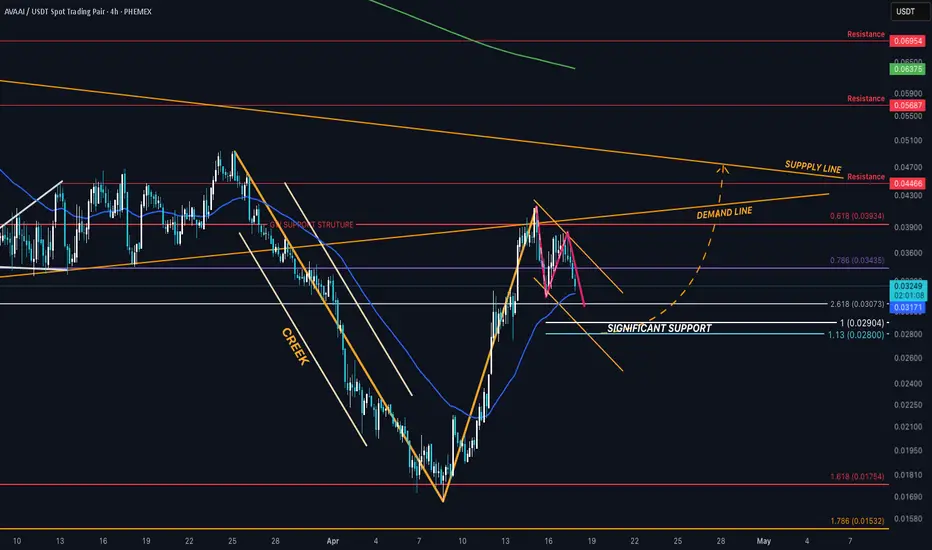
AVAAIUSDT.P – Long Setup at Key Fibonacci Support (61.8–78.6%)AVAAIUSDT.P has pulled back into a strong Fibonacci retracement zone after a sharp bullish impulse. The current zone (61.8%–78.6%) aligns with previous price structure, offering a solid risk-to-reward setup for a long entry.
Monitoring MACD for confirmation of a bullish crossover or histogram shift

AVAAI/USDT: FALLING WEDGE BREAKOUT! 90%+ PROFIT POTENTIAL!!AVAAI Breakout Alert – 90%+ Potential on the Table
Hey Traders — if you're into high-conviction setups with real momentum, this one’s for you.
AVAAI has officially broken out of a falling wedge structure on the 4H timeframe — a classic bullish reversal pattern. After weeks of downtrend, price fina

AVAAI/USDTKey Level Zone: 0.06600 - 0.06900
HMT v8.1 detected. The setup looks promising, supported by a previous upward/downward trend with increasing volume and momentum, presenting an excellent reward-to-risk opportunity.
HMT (High Momentum Trending):
HMT is based on trend, momentum, volume, and market s

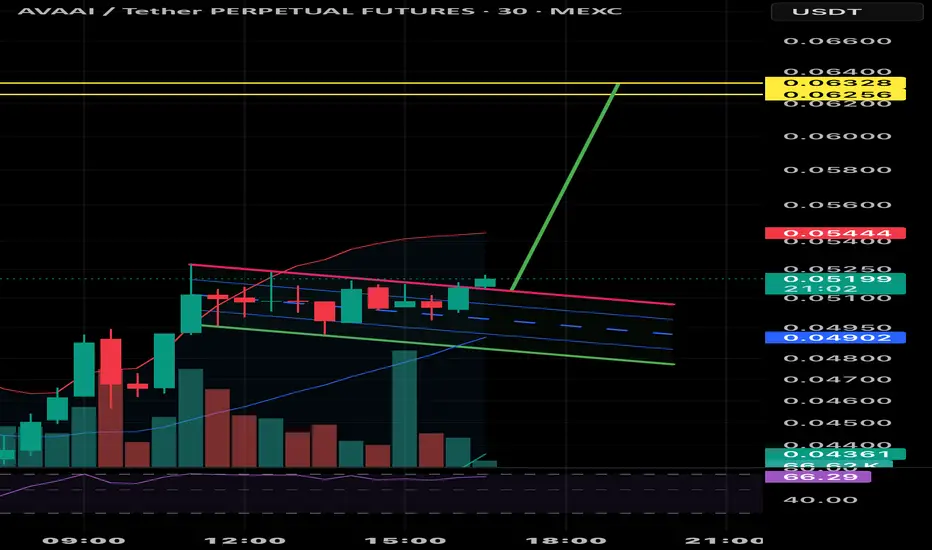
Trend is your friend till end - AVAAIAVAAI/USDT is one of the few cryptocurrencies which show a clear uptrend, and trend is your friend till the end.
If BTC bounces, I expect to re-test mid-channel of the trend,
Posting this as an idea and to learn more about trading, any comments are welcome.

$AVAAI Looks Ready to Explode — Don’t Blink!$AVAAI looks locked in for the next leg up.
After a clean breakout from the previous resistance zone, the price is now forming a solid base above its classic bullish structure.
The trendline’s been respected. Buyers stepped in early.
Volume’s healthy. Structure’s is strong.
In my view, the chart i

3 Wave Continuation PatternAVA is printing what appears to be a small 3 wave correction right above a support area and 50 EMA.
The correction is descending, which adds more bullish confluence.
It recently experienced a nice bullish engulf/ 'V' shaped recovery/ Wyckoff Spring that rhymed very nicely with the SOL chart.
T
See all ideas
Summarizing what the indicators are suggesting.
Oscillators
Neutral
SellBuy
Strong sellStrong buy
Strong sellSellNeutralBuyStrong buy
Oscillators
Neutral
SellBuy
Strong sellStrong buy
Strong sellSellNeutralBuyStrong buy
Summary
Neutral
SellBuy
Strong sellStrong buy
Strong sellSellNeutralBuyStrong buy
Summary
Neutral
SellBuy
Strong sellStrong buy
Strong sellSellNeutralBuyStrong buy
Summary
Neutral
SellBuy
Strong sellStrong buy
Strong sellSellNeutralBuyStrong buy
Moving Averages
Neutral
SellBuy
Strong sellStrong buy
Strong sellSellNeutralBuyStrong buy
Moving Averages
Neutral
SellBuy
Strong sellStrong buy
Strong sellSellNeutralBuyStrong buy
Displays a symbol's price movements over previous years to identify recurring trends.
Frequently Asked Questions
The current price of Ava AI / Tether USD (AVASOL) is 0.00942 USDT — it hasn't changed in the past 24 hours. Try placing this info into the context by checking out what coins are also gaining and losing at the moment and seeing AVASOL price chart.
Ava AI / Tether USD (AVASOL) reached its highest price on Nov 22, 2024 — it amounted to 0.89995 USDT. Find more insights on the AVASOL price chart.
See the list of crypto gainers and choose what best fits your strategy.
See the list of crypto gainers and choose what best fits your strategy.
Ava AI / Tether USD (AVASOL) reached the lowest price of 0.00601 USDT on Jun 24, 2025. View more Ava AI / Tether USD dynamics on the price chart.
See the list of crypto losers to find unexpected opportunities.
See the list of crypto losers to find unexpected opportunities.
The safest choice when buying AVASOL is to go to a well-known crypto exchange. Some of the popular names are Binance, Coinbase, Kraken. But you'll have to find a reliable broker and create an account first. You can trade AVASOL right from TradingView charts — just choose a broker and connect to your account.
Crypto markets are famous for their volatility, so one should study all the available stats before adding crypto assets to their portfolio. Very often it's technical analysis that comes in handy. We prepared technical ratings for Ava AI / Tether USD (AVASOL): today its technical analysis shows the sell signal, and according to the 1 week rating AVASOL shows the sell signal. And you'd better dig deeper and study 1 month rating too — it's neutral. Find inspiration in Ava AI / Tether USD trading ideas and keep track of what's moving crypto markets with our crypto news feed.
You can discuss Ava AI / Tether USD (AVASOL) with other users in our public chats, Minds or in the comments to Ideas.