AXS OutlookGiven the current market conditions, I think AXS could move above $2 at any time with a single move.
Market insights

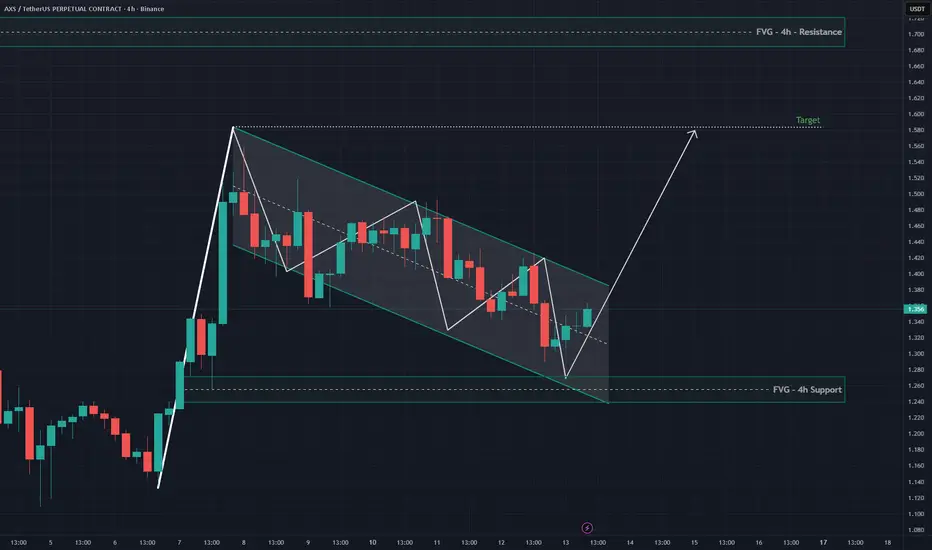
AXS NYSE:AXS 4H chart showing a falling channel structure, price just bounced perfectly from the 4h FVG support zone.
A potential bullish breakout could target the $1.58 area, aligning with the upper channel and 4h resistance zone.
Looks like smart money accumulation in progress.
#AXSUSDT #Crypto #YodaXCalls
AXSUSDT and SLPUSDT are next 10X do not lose it Both AXS and SLP are fundamentally robust tokens with strong interlinked utilities. From a technical perspective, they are currently trading at a historically significant support zone, suggesting a potential market bottom. This convergence of positive fundamentals and oversold technical conditions presents a compelling case for a substantial upward revaluation. A significant price appreciation, potentially reaching a 10X return, is a plausible scenario upon a market resurgence.
DISCLAIMER: ((trade based on your own decision))
<<press like👍 if you enjoy💚

axs 20 oct 2025 analysisif today 20 oct 2025 daily close we can stand the price above 1.6 , possibly we can continue rally up

AXSUSDT: Trend in weekly timeframeThe color levels are very accurate levels of support and resistance in different time frames, and we have to wait for their reaction in these areas.
So, Please pay special attention to the very accurate trend, colored levels, and you must know that SETUP is very sensitive.
Be careful
BEST
MT
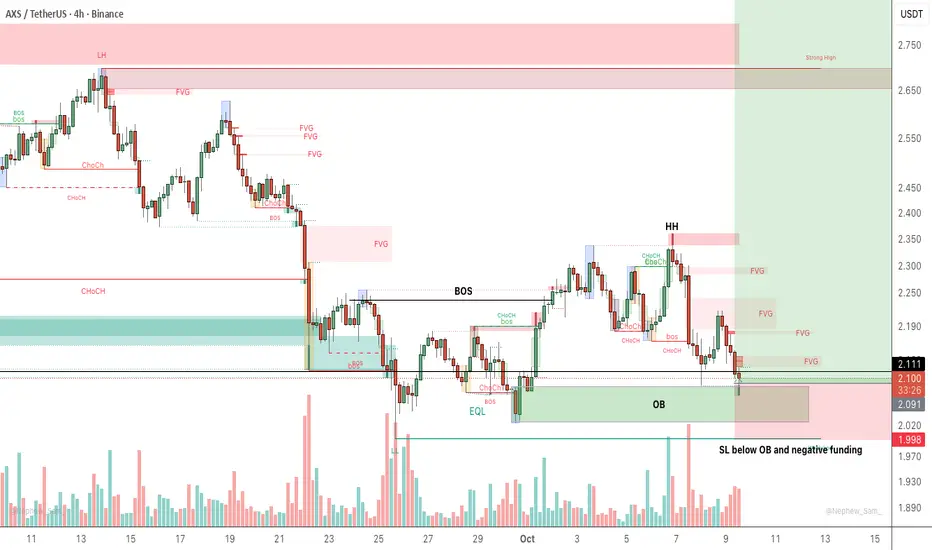
Longed/bought AXS Price traded into OB so trying a leverage long on AXS as fits setup. The RR down here is good and if get a good reaction will let this one run. Negative funding on it also so people are heavily shorting down here which seems a bad idea.
AXS USDT LONG TRADE SETUPAXS-USDT
LONG
Entry: 2.159 or CMP
Target: TP1: 2.290, TP2: 2.421, TP3: 2.552, TP4: 2.682
Stoploss: 1.976
Leverage: 1X
Technical Analysis: AXS/USDT is taking support from its support area there is high change of of trend reversal, we can see up trend soon.

AXS/USDT – Eyeing a Long Setup | Weekly FVGs Above & Key 4H ConfAXS is currently trading below multiple Fair Value Gaps (FVGs) on the higher timeframes, with strong confluence zones forming on the 4H chart.
Weekly Chart Outlook:
Two bullish FVGs above price:
$4.65 – $5.52 (major imbalance zone)
$4.00 (minor FVG)
Two bearish FVGs below price:
$1.88
$0.66 (extreme low – could be tapped only if the market turns strongly bearish)
4H Chart Structure:
Active FVG: $2.34 – $2.37 → aligns perfectly with the 200 MA, a key dynamic resistance.
Below price: three smaller FVGs
$2.17 – $2.12 (near 50 MA, solid demand)
$2.00 zone (historical liquidity pocket)
Momentum: RSI rising from oversold; structure forming potential higher low.
💡 Bias & Plan:
Watching for a retrace into $2.17–$2.12 to confirm a higher low before entering long.
Targeting the $2.34 – $2.37 FVG first, and eventually the $4.00+ zone if momentum sustains.
Invalidation below $1.95.
If the broader market enters a deeper bear cycle, the $0.66–$1.88 levels could be revisited — however, at current momentum and liquidity structure, such retrace would likely take several months, not immediate.
---
⏳ Expected Timing:
If BTC maintains range-bound or mildly bullish momentum, the $0.66 zone would only be hit in a full macro downturn, potentially in 2026 or later.
Short term (1–3 weeks): expecting reaction around **$2.12–$
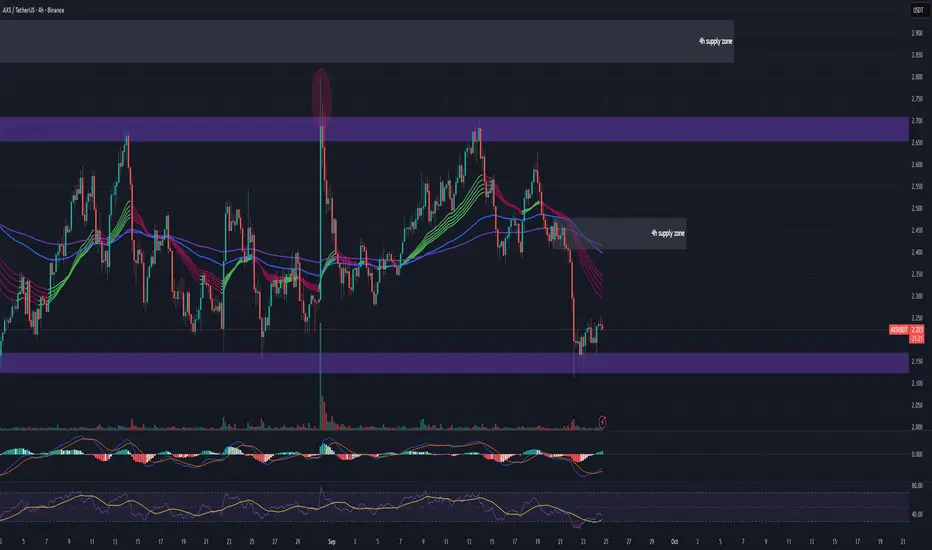
#AXSUSDT 4H ChartPrice previously moved up after retesting the support at $2.15. MACD is showing bullish momentum, RSI is sold and EMAs are bearish. Mixed indications overall, but price needs to breaks and close above $2.25 in order to expect further bullish development aiming towards the 4h supply zone around $2.41 as a midterm target.
axs long position i see a nice chart and a nice accumulation phase so i risk amount of money with lev8
lets see what will happened

AXS LONG TRADE SETUPNew Trade Setup: AXS-USDT
LONG
Entry: 2.375 or CMP
Target: TP1: 2.481, TP2: 2.587, TP3: 2.692, TP4: 2.798
Stoploss: 2.096
Leverage: 1X
Technical Analysis: AXS/USDT is taking support from its support area there is high change of short term of trend reversal, we can see up trend in short term

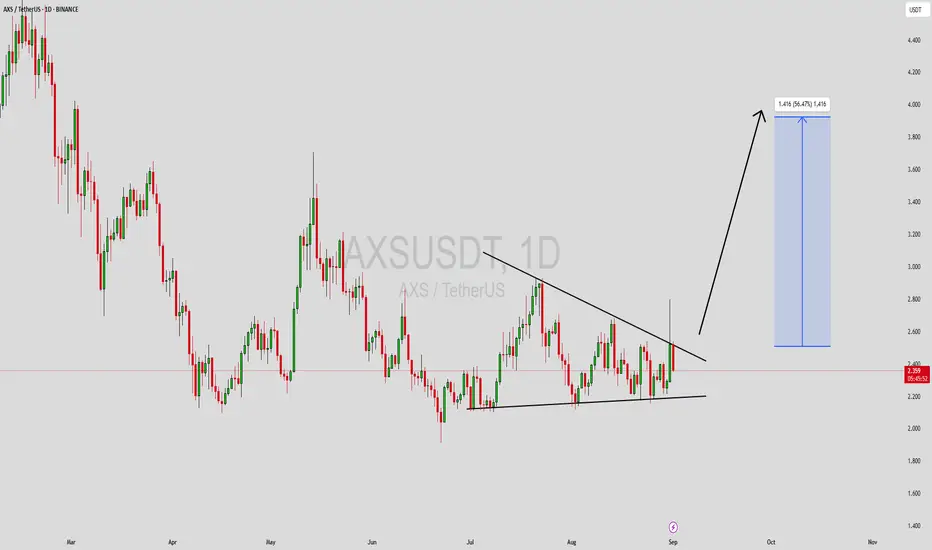
AXSUSDT Forming Potential BreakoutAXSUSDT is showing signs of forming a potential breakout structure after a long period of consolidation. The chart setup indicates a tightening range with higher lows and lower highs, which often precedes a strong move in either direction. With the current market sentiment improving and investors beginning to accumulate positions, the probability of an upside breakout appears favorable. If momentum builds, this setup could drive AXS toward a strong bullish run.
The trading volume has been supportive, suggesting that market participants are closely watching this level for confirmation. A decisive breakout from the resistance trendline could trigger a wave of buying pressure, unlocking a move of around 40% to 50%+ from the current levels. This makes AXSUSDT an attractive opportunity for traders looking for short to mid-term gains.
Market participants are increasingly paying attention to projects like AXS, which have established strong use cases and community support. The technical structure combined with renewed investor interest creates a promising environment for further upside potential. Should the breakout confirm, the momentum could drive price action into a new bullish phase.
✅ Show your support by hitting the like button and
✅ Leaving a comment below! (What is You opinion about this Coin)
Your feedback and engagement keep me inspired to share more insightful market analysis with you!
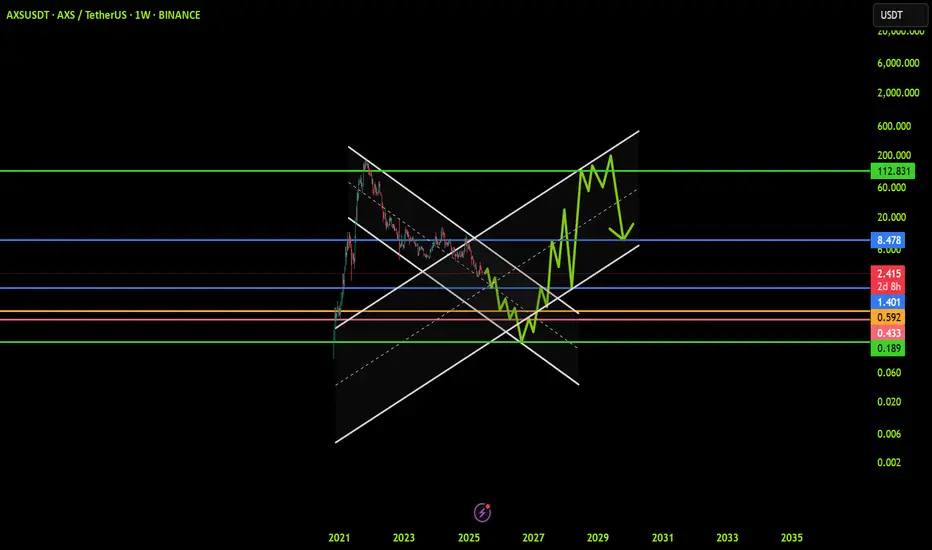
Axie Infinity Trades Within Opportunity Buy Zone · (PP: 16,253%)Right now Axie Infinity is trading within the "opportunity buy zone," this is a level just below the support zone from 2024, 2023 and 2022. It is trading in this zone searching for liquidity. Once this move is over, AXSUSDT will never be available at these prices in the future. The lowest will be the long-term support zone from 2022-2024.
Can Axie Infinity hit a new all-time high in 2025 or 2026? It is possible. But, in this chart setup and analysis we are focusing on high probability conservative targets.
"Back to baseline" is the very easy target. The first target after that sits around $20 for 677%. The main target goes higher, $32 for 1,111%. A strong target is $55 and this one opens up 1,983% profits potential.
A new all-time high can be $268 & $435. Really huge numbers. Just to give you an idea, the second one would be equal to 16,253% profits potential. The first one, $268 would be equal to 9,975%. This is theoretically possible so I don't want to commit to it but is good to keep an open mind with market conditions improving at the speed of light. If we can say there is such a thing.
Technical analysis
The bottom in 2025 matches the mid-way stop of the 2021 bull market. So this is an interesting and valid zone for a reversal.
We don't need to go any deeper in looking for reversal signals because a marketwide bullish bias is already confirmed. We've been bullish since 7-April 2025. Some pairs move first others later though and that's why some are already very high while others are very low. This is good because it gives us time to adapt to the market. If everything were to move together at the same time on the same date, it would be too late to buy anything low. Because the market cycles through different sectors, groups and pairs, we can buy the ones that are low now knowing that they will eventually move ahead. Everything grows. Everything will grow. The 2025 bull market is already confirmed.
Thanks a lot for your continued support.
Namaste.

axs target bia Price (USD)
62 ┤ 🎯 Final Long-term Target
55 ┤ ⚡ Strong Resistance / Major Target
48 ┤ 🎯 Mid-term Target
42 ┤ 🎯 Mid-term Target
35 ┤ ⚡ Resistance / Short-term Target
28 ┤ 🎯 Short-term Target
2.472 ┤━━━━━━ 🔹 Current Price / Strong Support
⚡ Major Support
**"🚀🚀🚀 Attention Whales! 🚀🚀🚀
AXS is blasting off at just $2.472 — the ultimate accumulation zone for smart whales.
Why move now:
✅ Massive gaming & NFT ecosystem powering growth.
✅ Explosive community adoption and rising liquidity.
✅ Entry this low = potential for astronomical upside.
Targets & Price Ladder:
Short-term blast: $28 → $35 → $42
Mid-term orbit: $48 → $55
Final moon target: $62+ 🌕
This is what whales live for:
🔹 Ultra-low entry at $2.472
🔹 Strong support at $2.20 = risk control
🔹 Clear path for mega gains 🚀🚀
The crowd will scramble after the rocket has taken off.
Smart whales load now, lead the pump, and ride the full rocket to the moon! 🌕💥"**

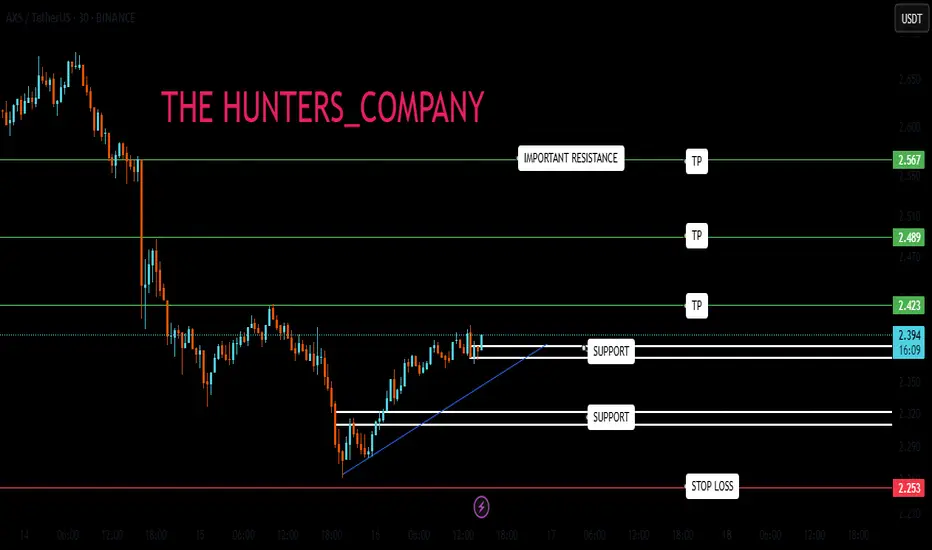
AXS : Buy signal?Hello friends
Given the decline we had, the price has recovered well and gone up.
Now, if the specified support area is maintained, it can move to the specified resistances.
If it continues to decline, we have a more important support below, which can be a good support, but if it declines further and the stop loss is broken, it means that our trend is down.
*Trade safely with us*
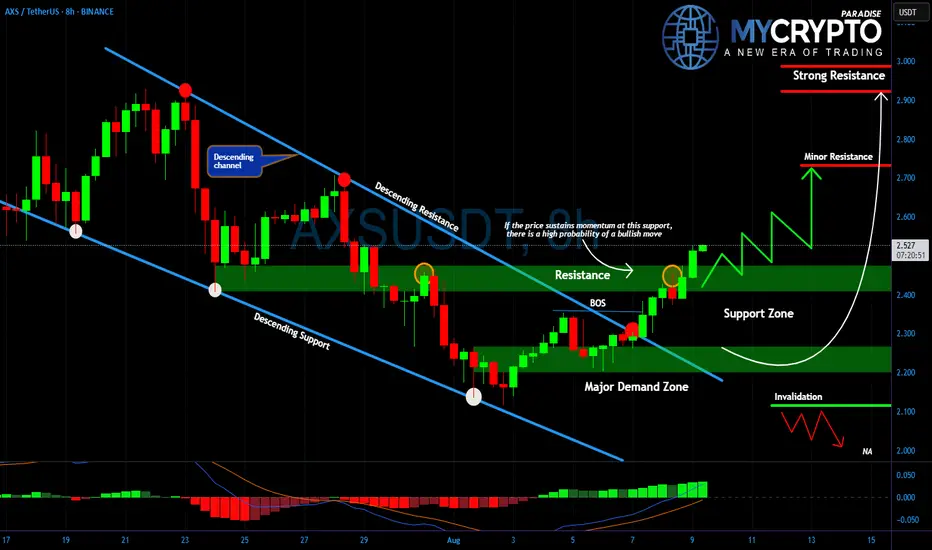
AXS :Breakout to Glory or Just Another Painful Bull Trap Ahead?Yello could this #AXSUSDT breakout be the start of something big, or is it the perfect setup to liquidate the impatient before the real move? After weeks of being trapped inside a grinding descending channel, price has finally punched through resistance… but the market is never that generous without a catch.
💎For nearly a month, #AXS kept bouncing between descending resistance and support, with every bullish attempt slapped back down. That pattern ended when price broke cleanly above $2.40, flipping a stubborn resistance level into fresh support. This is a textbook Break of Structure (BOS) and a sign that buyers are finally stepping in with force.
💎The $2.10 to $2.20 demand zone remains the ultimate foundation for bulls. As long as it holds, market sentiment stays in their favor. The newly reclaimed $2.40 to $2.45 area now acts as immediate support, and losing it could invite a quick reversal back into the previous bearish structure. On the upside, $2.70 stands as the first key level where sellers might reappear, while a decisive breakout above $2.90 could trigger a rapid rally. If price closes below $2.10, the bullish case collapses entirely and the downtrend resumes.
💎The MACD has just printed a bullish cross with rising histogram bars, reinforcing the breakout momentum. Still, experienced traders know that such breakouts often retrace sharply before continuing higher, shaking out weak hands along the way.
🎖Strive for consistency, not quick profits. Treat the market as a businessman, not as a gambler.
MyCryptoParadise
iFeel the success🌴
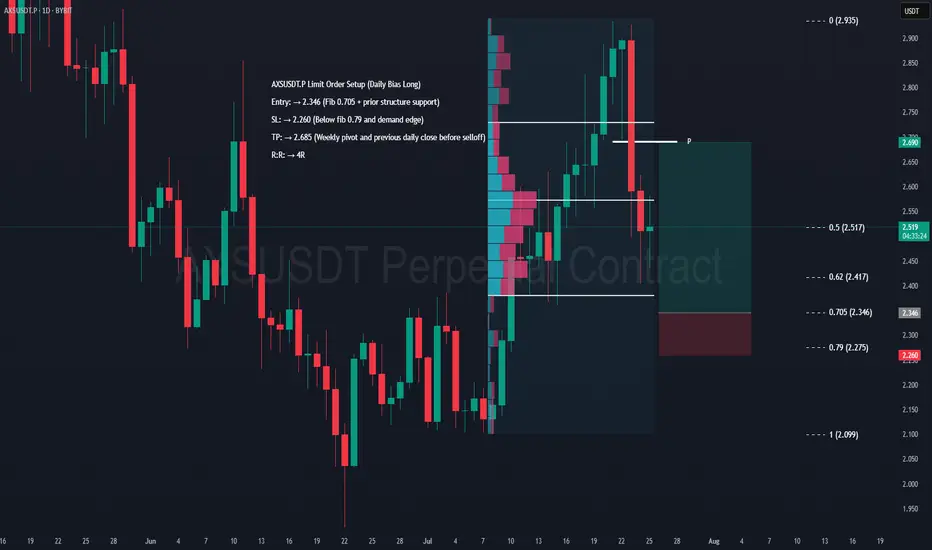
AXS Swing Long Setup – Daily Confluence TradeAXS Limit Order Setup (Daily Bias Long)
Entry: → 2.346 (Fib 0.705 + prior structure support)
SL: → 2.260 (Below fib 0.79 and demand edge)
TP: → 2.685 (Weekly pivot and previous daily low before selloff)
R:R: → 4R
DISCLAIMER: I am not providing trading signals or financial advice. The information shared here is solely for my own documentation and to demonstrate my trading journey. By openly sharing my process, I aim to put pressure on myself to stay focused and continually improve as a trader. If you choose to act on any of this information, you do so at your own risk, and I will not be held responsible for any outcomes. Please conduct your own research and make informed decisions.
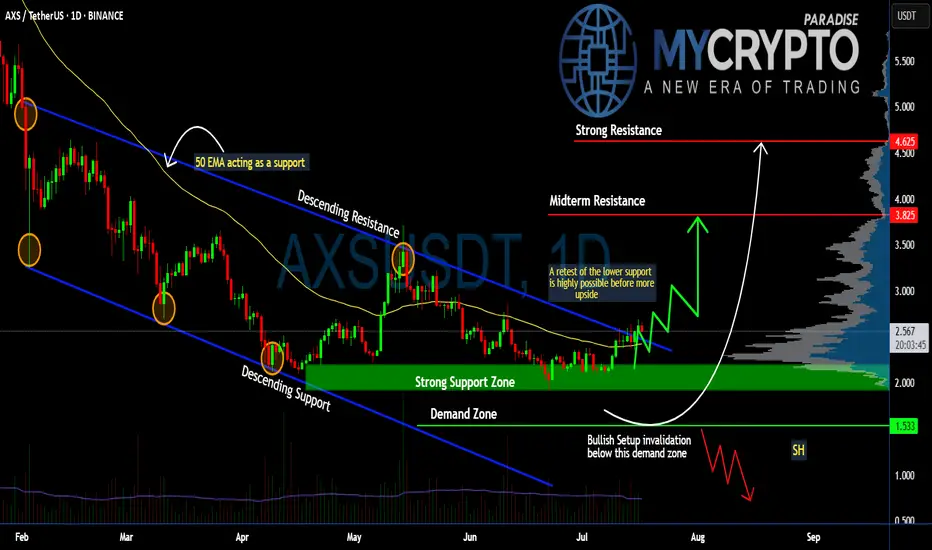
Can #AXS Bulls Sustain the Momentum or Will it Fall? Key LevelsYello, Paradisers! Will #AXS finally deliver a strong upside move, or are we just seeing another setup to trap impatient bulls before a deeper drop? Let’s break down the latest #AXSUSDT structure:
💎After months inside a descending channel, #AxieInfinity has finally broken above the descending resistance, showing early signs of a potential trend reversal. The current price trades around $2.56, but history tells us a retest of lower levels is still highly possible before any sustained upside move. The soaring volume and a positive broader market outlook reinforce our bullish bias.
💎The structure is clear: the strong support zone sits between $2.20–$2.00, and this is the first critical level to watch. A healthy retest here would provide a high-probability continuation setup for bulls. Below that, the demand zone at $1.53 is the last stronghold—losing this level would invalidate the bullish scenario completely.
💎If buyers maintain control, the first upside target stands at the midterm resistance of $3.82, where some profit-taking and selling pressure are expected. A clean breakout above this zone could push the price toward the strong resistance at $4.62, where major distribution could occur.
💎However, the bullish setup becomes invalid if #AXSUSD loses the $1.53 demand zone. A confirmed daily close below this level would flip the structure bearish and open the door for a move to new lows.
Stay patient, Paradisers. Let the breakout confirm, and only then do we strike with conviction.
MyCryptoParadise
iFeel the success🌴
AXS - We are on support, next rocket 180%At the moment, the price is in the testing zone of the lower boundary of the descending channel. This is a critical level that will determine the further direction of movement. If the price bounces off the support, we can expect an upward correction. If the price breaks through the support, we should expect a further fall.
Recommended signal: Waiting for confirmation of the breakout of the lower boundary of the channel to enter shorts or a rebound from support to enter longs.
Price range forecast for the next 3 days: 1.50–2.30 USDT.

#AXSUSDT #4h (Bitget Futures) Falling wedge breakout and retestAxie Infinity just pulled back to 50MA support where it's bouncing, looks ready for recovery towards 200MA resistance and more.
⚡️⚡️ #AXS/USDT ⚡️⚡️
Exchanges: Bitget Futures
Signal Type: Regular (Long)
Leverage: Isolated (4.0X)
Amount: 4.7%
Current Price:
2.509
Entry Zone:
2.489 - 2.407
Take-Profit Targets:
1) 2.758
2) 2.991
3) 3.224
Stop Targets:
1) 2.189
Published By: @Zblaba
NYSE:AXS BITGET:AXSUSDT.P #4h #AxieInfinity #P2E axieinfinity.com
Risk/Reward= 1:1.2 | 1:2.1 | 1:3.0
Expected Profit= +50.7% | +88.7% | +126.8%
Possible Loss= -42.3%
Estimated Gaintime= 1-2 weeks

AXSUSDT 1D Analysis AXS ~ 1D Analysis
#AXS Buy gradually from here if you still have confidence in this coin with a short term target of at least 15%++

AXS/USDT (6H) – Downtrend Resistance Test in Progress AXS/USDT (6H) – Downtrend Resistance Test in Progress
Pattern: Descending Trendline Breakout
Timeframe: 6-Hour ⏱️
Pair: AXS/USDT 💱
Published: June 11, 2025 📅
Technical Overview:
AXS/USDT is approaching a key descending trendline that has capped price action since early June. Price is testing this dynamic resistance and showing signs of potential breakout momentum 📈
Potential Trade Setup:
Bullish Scenario ✅
Entry: On breakout and 6H candle close above 2.800–2.850
Targets:
* TP1: 3.000–3.100 🎯
* TP2: 3.300–3.400 🎯
Stop-loss: Below 2.600–2.650 🛑
Risk Management ⚠️
Wait for volume confirmation to avoid fakeouts. Rejection at the trendline could lead to more downside or consolidation.
Conclusion:
AXS is at a critical resistance zone. A clean breakout above the trendline may lead to a bullish reversal and upside continuation 📊🔍

AXSUSDT Analysis AXS is showing signs of a potential breakout after breaking the descending trendline and reclaiming the 50 EMA. Price is currently testing a key resistance zone between 2.62–2.80 USDT.
🟦 Key Levels:
Support: 2.50 – 2.46 USDT
Resistance: 2.62 – 2.80 USDT
🔀 Two Possible Scenarios: ✅ Bullish: Price holds above support and breaks through 2.80 → potential rally toward 3.00+ ❌ Bearish: Rejection from resistance → retest of support around 2.50 → possible breakdown if support fails
🔄 Waiting for a confirmed retest or breakout for the next move.
📊 Plan your trades, manage your risk.
#AXS #AxieInfinity #CryptoTrading #TA #Altcoins #TradingView #PriceAction #BreakoutSetup
