AXS OutlookGiven the current market conditions, I think AXS could move above $2 at any time with a single move.

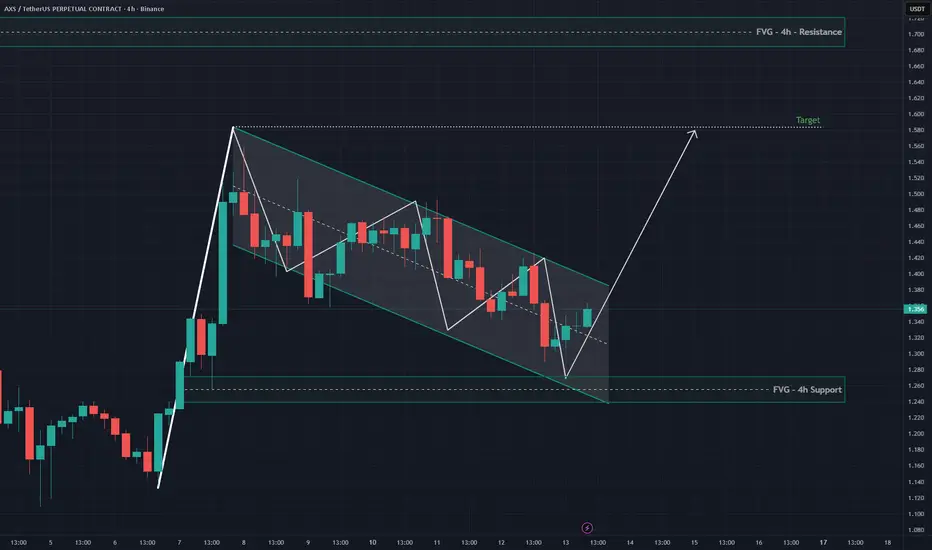
AXS NYSE:AXS 4H chart showing a falling channel structure, price just bounced perfectly from the 4h FVG support zone.
A potential bullish breakout could target the $1.58 area, aligning with the upper channel and 4h resistance zone.
Looks like smart money accumulation in progress.
#AXSUSDT #Crypto #
AXSUSDT and SLPUSDT are next 10X do not lose it Both AXS and SLP are fundamentally robust tokens with strong interlinked utilities. From a technical perspective, they are currently trading at a historically significant support zone, suggesting a potential market bottom. This convergence of positive fundamentals and oversold technical conditions p

axs 20 oct 2025 analysisif today 20 oct 2025 daily close we can stand the price above 1.6 , possibly we can continue rally up

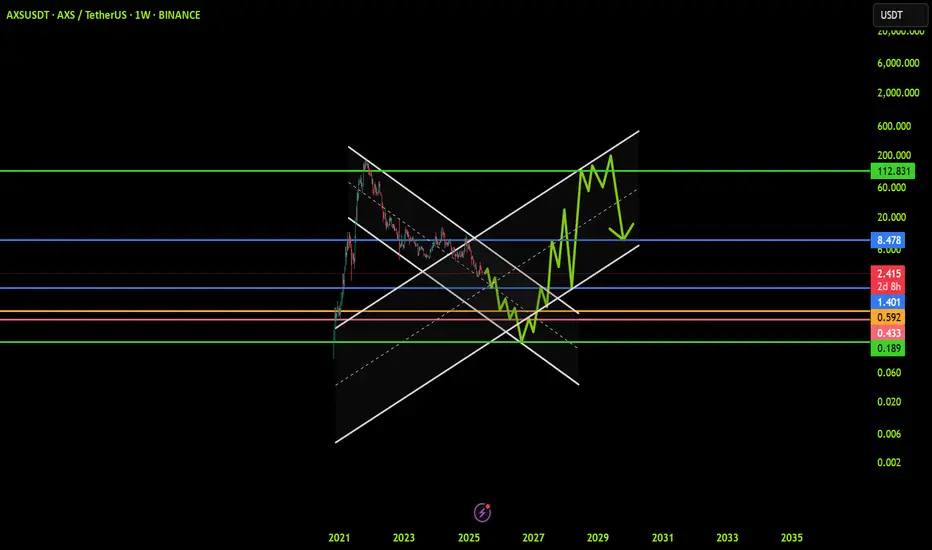
AXSUSDT: Trend in weekly timeframeThe color levels are very accurate levels of support and resistance in different time frames, and we have to wait for their reaction in these areas.
So, Please pay special attention to the very accurate trend, colored levels, and you must know that SETUP is very sensitive.
Be careful
BEST
MT
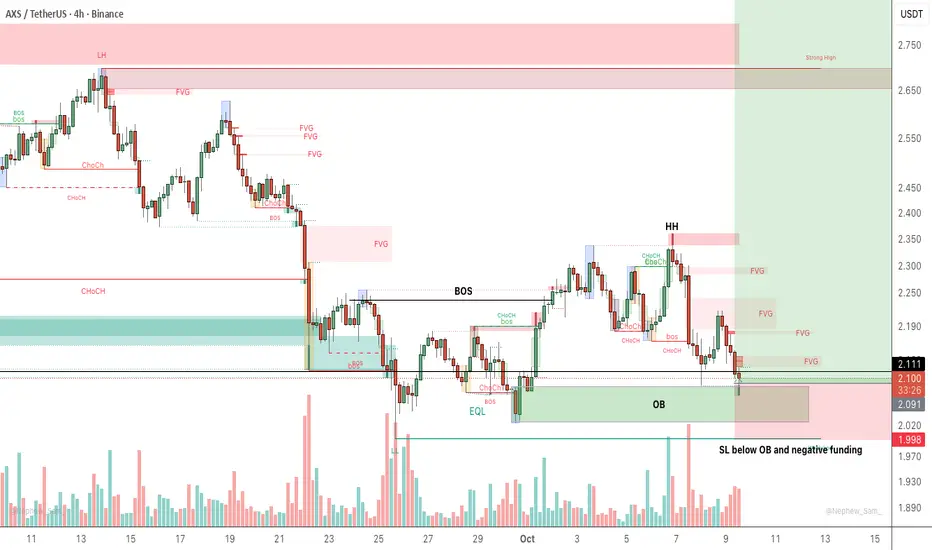
Longed/bought AXS Price traded into OB so trying a leverage long on AXS as fits setup. The RR down here is good and if get a good reaction will let this one run. Negative funding on it also so people are heavily shorting down here which seems a bad idea.
AXS USDT LONG TRADE SETUPAXS-USDT
LONG
Entry: 2.159 or CMP
Target: TP1: 2.290, TP2: 2.421, TP3: 2.552, TP4: 2.682
Stoploss: 1.976
Leverage: 1X
Technical Analysis: AXS/USDT is taking support from its support area there is high change of of trend reversal, we can see up trend soon.

AXS/USDT – Eyeing a Long Setup | Weekly FVGs Above & Key 4H ConfAXS is currently trading below multiple Fair Value Gaps (FVGs) on the higher timeframes, with strong confluence zones forming on the 4H chart.
Weekly Chart Outlook:
Two bullish FVGs above price:
$4.65 – $5.52 (major imbalance zone)
$4.00 (minor FVG)
Two bearish FVGs below price:
$1.88
$0.66
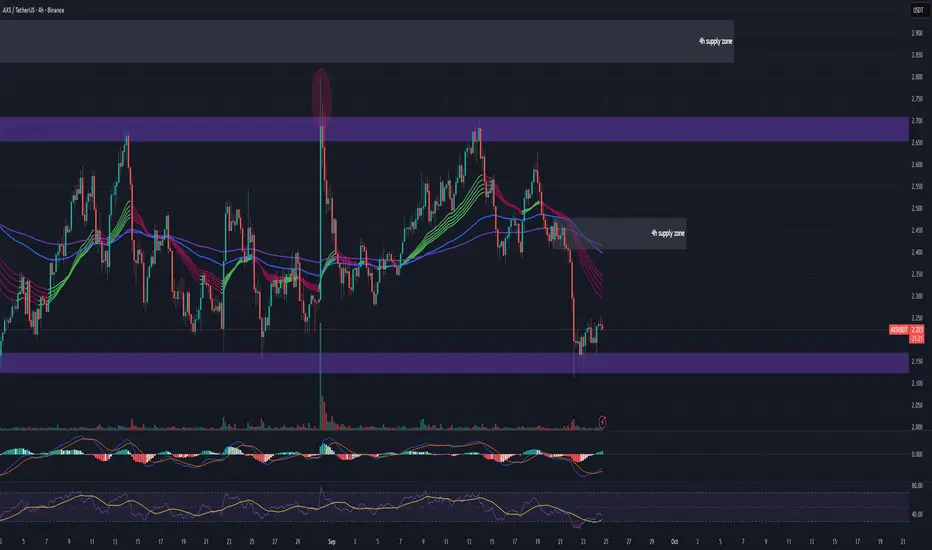
#AXSUSDT 4H ChartPrice previously moved up after retesting the support at $2.15. MACD is showing bullish momentum, RSI is sold and EMAs are bearish. Mixed indications overall, but price needs to breaks and close above $2.25 in order to expect further bullish development aiming towards the 4h supply zone around $2.41
axs long position i see a nice chart and a nice accumulation phase so i risk amount of money with lev8
lets see what will happened

See all ideas
Summarizing what the indicators are suggesting.
Oscillators
Neutral
SellBuy
Strong sellStrong buy
Strong sellSellNeutralBuyStrong buy
Oscillators
Neutral
SellBuy
Strong sellStrong buy
Strong sellSellNeutralBuyStrong buy
Summary
Neutral
SellBuy
Strong sellStrong buy
Strong sellSellNeutralBuyStrong buy
Summary
Neutral
SellBuy
Strong sellStrong buy
Strong sellSellNeutralBuyStrong buy
Summary
Neutral
SellBuy
Strong sellStrong buy
Strong sellSellNeutralBuyStrong buy
Moving Averages
Neutral
SellBuy
Strong sellStrong buy
Strong sellSellNeutralBuyStrong buy
Moving Averages
Neutral
SellBuy
Strong sellStrong buy
Strong sellSellNeutralBuyStrong buy
Displays a symbol's price movements over previous years to identify recurring trends.