BAKEUSDT another 2x at least is cookingAs observed on the chart, the price is currently testing a major daily support level, which has already catalyzed a strong rebound. The initial move, resulting in approximately 100% appreciation and supported by notably high trading volume, indicates substantial buying interest and validates the strength of this support zone.
Given this confirmed momentum and volume-backed conviction, the technical structure now suggests the potential for further appreciation. A sustained move from this level could project an additional 100% to 200% gain, provided the asset maintains its current momentum and the support zone continues to hold.
DISCLAIMER: ((trade based on your own decision))
<<press like👍 if you enjoy💚
Market insights


Rating Agencies and the Risk Premium in Cross-Border Trade1. Understanding Rating Agencies
1.1 Origins and Evolution
Credit rating agencies emerged in the early 20th century with the rise of bond markets. Firms like Moody’s (1909), Standard & Poor’s (1916), and later Fitch (1924) pioneered systematic evaluations of borrowers’ ability to meet financial obligations. Initially, their focus was corporate and municipal bonds in the U.S., but as globalization expanded, they became central players in sovereign debt and international trade finance.
1.2 Functions of Rating Agencies
Credit Evaluation: Assess the ability and willingness of borrowers (countries, companies, banks) to repay debt.
Risk Communication: Provide standardized symbols (AAA, BB, etc.) that simplify complex financial risk.
Market Signal: Ratings influence investor sentiment, government borrowing costs, and capital flows.
Trade Facilitation: Enable exporters, importers, and financial intermediaries to price risk accurately.
2. The Concept of Risk Premium in Trade
2.1 Definition
The risk premium is the excess return demanded by investors or lenders above the risk-free rate (often benchmarked against U.S. Treasuries) to compensate for uncertainties in lending or trading across borders.
2.2 Determinants of Risk Premium
Sovereign Risk: Default probability of a government.
Currency Risk: Volatility of exchange rates.
Political Risk: Policy instability, regulatory unpredictability, corruption.
Macroeconomic Risk: Inflation, growth volatility, balance of payments deficits.
Legal and Institutional Risk: Strength of judicial systems, enforceability of contracts.
2.3 Link Between Ratings and Risk Premium
Higher credit ratings → lower perceived risk → lower premiums.
Downgrades → capital flight, higher borrowing costs, reduced competitiveness in trade.
Upgrades → cheaper financing, enhanced investor confidence, greater access to cross-border trade credit.
3. How Rating Agencies Influence Cross-Border Trade
3.1 Sovereign Ratings and Trade Finance
Exporters and importers rely heavily on sovereign ratings. For example, a downgrade of a country from investment grade (BBB-) to junk (BB+) leads to higher trade financing costs, discouraging importers from accessing credit lines.
3.2 Corporate Ratings and International Borrowing
Multinational corporations operating in emerging markets often borrow in international bond markets. Their corporate ratings are closely tied to their home country’s sovereign ceiling. This directly impacts their ability to secure financing for large-scale trade projects.
3.3 Impact on Foreign Direct Investment (FDI)
FDI flows often follow rating signals. Countries with higher ratings attract more stable FDI inflows, which in turn improve their export capacity and competitiveness.
3.4 Role in Insurance and Hedging
Insurance providers (like export credit agencies or private insurers) use ratings to price political risk insurance, export guarantees, and hedging contracts. A downgrade inflates premiums, raising the cost of trade deals.
4. Case Studies
4.1 The Asian Financial Crisis (1997–1998)
During the Asian crisis, rating agencies rapidly downgraded countries such as Thailand, Indonesia, and South Korea. This triggered massive capital outflows, widened spreads on sovereign bonds, and raised the cost of trade financing. Critics argue agencies acted procyclically—exacerbating the crisis instead of signaling risks earlier.
4.2 The Eurozone Debt Crisis (2010–2012)
Countries like Greece, Portugal, and Spain saw their ratings slashed. Borrowing costs skyrocketed, with spreads over German bunds widening dramatically. Trade flows contracted as financing became prohibitively expensive. The crisis underscored how rating downgrades could destabilize entire regions.
4.3 Emerging Markets Today
For countries like India, Brazil, or South Africa, ratings directly affect the credit default swap (CDS) spreads and cost of issuing international trade bonds. Upgrades reduce premiums, attracting more exporters and foreign partners.
5. Methodologies of Rating Agencies
5.1 Quantitative Metrics
GDP growth rate and stability
Fiscal deficit and debt-to-GDP ratio
Inflation and currency stability
External balances and foreign reserves
5.2 Qualitative Metrics
Political stability and governance quality
Institutional independence (central bank, judiciary)
Corruption perception
Policy predictability
5.3 Limitations
Heavy reliance on past data (lagging indicator)
Possible biases toward developed economies
Susceptibility to political pressure and conflicts of interest
6. Criticisms of Rating Agencies
6.1 Procyclicality
Agencies tend to downgrade after crises erupt, worsening investor panic. This magnifies risk premiums and creates a feedback loop of rising costs and falling confidence.
6.2 Conflicts of Interest
The “issuer-pays” model means rating agencies are compensated by the very firms or governments they rate. This raises concerns of inflated ratings before crises (e.g., mortgage-backed securities before the 2008 financial meltdown).
6.3 Western-Centric Bias
Many emerging economies argue agencies apply stricter standards to them than to developed nations. For instance, Japan maintains high debt-to-GDP ratios but often retains relatively strong ratings compared to emerging economies with lower debt burdens.
6.4 Market Oligopoly
Three agencies (S&P, Moody’s, Fitch) control more than 90% of the global ratings market, creating limited competition and potential systemic bias.
7. Implications for Cross-Border Trade
7.1 Higher Transaction Costs
Downgrades lead to higher costs of letters of credit, trade insurance, and export guarantees.
7.2 Reduced Competitiveness of Emerging Economies
Countries downgraded to “junk” often lose access to affordable international trade finance, limiting their export-driven growth strategies.
7.3 Shifts in Trade Partnerships
Countries facing higher premiums may pivot toward alternative trade partners or rely more on bilateral agreements and currency swaps to bypass rating-driven constraints.
8. Alternative Models and Future Directions
8.1 Regional Rating Agencies
Asia, Africa, and Latin America are increasingly exploring regional credit rating agencies to counterbalance Western dominance and better reflect local conditions.
8.2 Role of Technology
Big Data & AI: Machine learning models could provide real-time credit risk assessment based on wider datasets (trade flows, political events, satellite data).
Blockchain & Transparency: Smart contracts and decentralized finance may reduce dependence on centralized agencies.
8.3 ESG Ratings
Environmental, Social, and Governance (ESG) criteria are becoming central to global trade finance. Agencies are developing frameworks to integrate sustainability risks into credit ratings, affecting long-term premiums.
8.4 Rise of Sovereign Wealth Funds & Development Banks
Institutions like the BRICS Bank or Asian Infrastructure Investment Bank are offering alternative sources of finance, reducing reliance on ratings-driven capital markets.
9. Policy Implications
9.1 For Governments
Maintain macroeconomic stability to secure strong ratings.
Diversify financing sources (e.g., regional development banks, local currency bonds).
Engage in transparent communication with agencies and investors.
9.2 For Corporates
Focus on governance and disclosure to improve ratings.
Use risk management tools (hedging, insurance) to mitigate rating-driven premiums.
Build cross-border partnerships to share risks.
9.3 For Global Regulators
Encourage competition among rating agencies.
Reduce reliance on ratings in regulatory frameworks (Basel III reforms).
Develop global standards for ESG integration.
10. Conclusion
Rating agencies play a pivotal role in shaping the risk premium in cross-border trade. Their ratings influence borrowing costs, trade financing, insurance pricing, and investment flows. A higher rating translates into lower premiums, opening doors for greater participation in global trade, while downgrades can choke access to capital and raise transaction costs.
Yet, the dominance of a few Western-based agencies, their procyclical behavior, and perceived biases remain pressing concerns. As the global economy becomes more multipolar, alternative rating frameworks, technological innovations, and regional cooperation will redefine the landscape of risk assessment.
In the future, the balance between market trust, institutional credibility, and technological transparency will determine how rating agencies evolve and how risk premiums are priced in the global trading system.
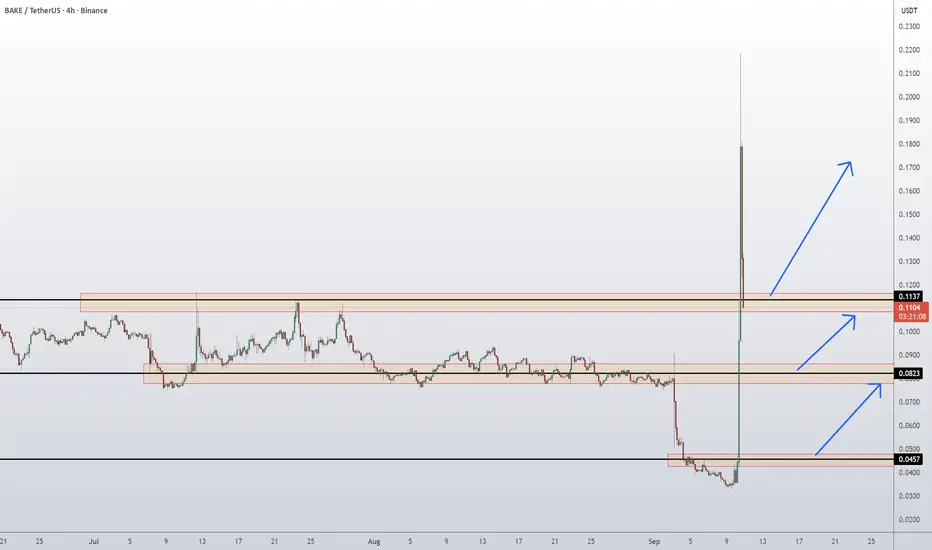
BakeryToken Bake Coin Price Prediction and Technical AnalysisBAKE/USDT just made a massive spike from the 0.0457 demand base, reclaiming lost ground after weeks of decline. Price has now surged into the 0.1137–0.1150 resistance zone, where sellers are showing signs of pressure. If bulls manage to hold above this reclaimed level, continuation toward 0.1820 looks possible. However, if price fails here, a healthy pullback toward 0.0823 support could unfold before another attempt higher.
📈 Key Levels:
Buy trigger: Retest/hold above 0.1137 support-turned-demand
Buy zone: 0.0823 – 0.1137 region
Target 1: 0.1820 resistance
Target 2: Extension toward 0.20+ if momentum continues
Invalidation: Daily close below 0.0457 (would negate the bullish recovery)
👉 Follow me for More Real Time Opportunities.
Share your Thoughts if you have any?
Bake / USDT : Strong rally aheadBake / USDT is currently trading at the bottom support and expecting big move soon..

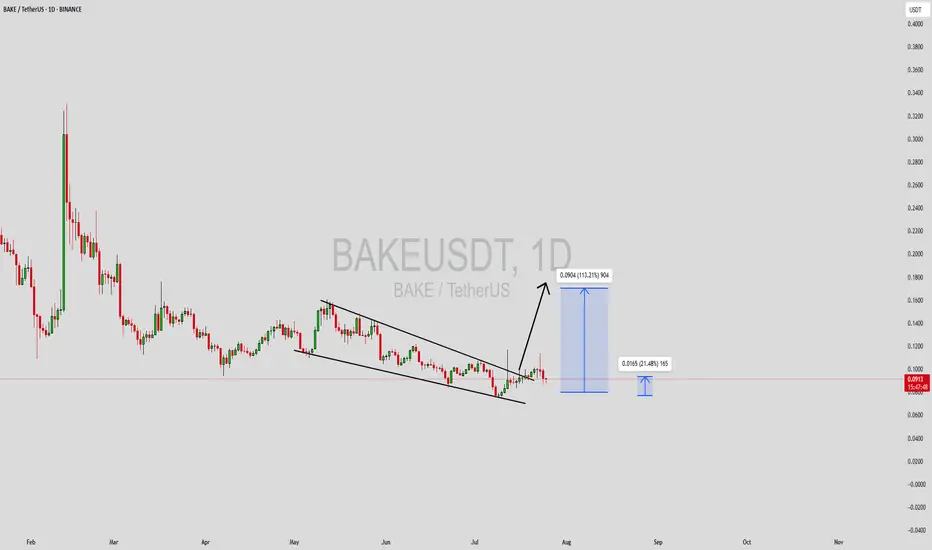
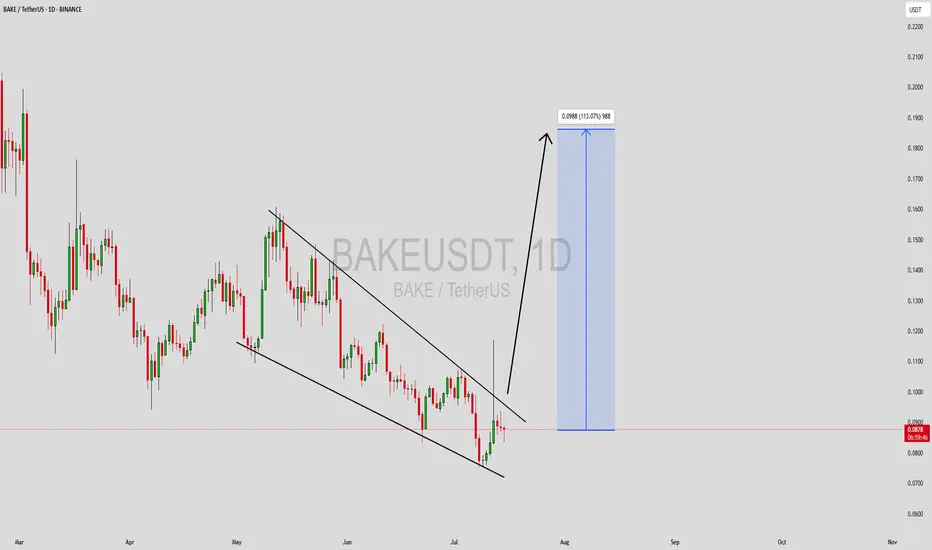
BAKEUSDT Forming Falling WedgeBAKEUSDT is presenting an interesting breakout scenario after forming a clean falling wedge pattern on the daily chart. Falling wedges are typically bullish reversal patterns, especially when confirmed by a breakout with volume. In this case, the wedge appears to be breaking to the upside, supported by a noticeable uptick in buying volume. Technical projections are pointing toward a potential price increase of 90% to 100%+, making this setup a valuable opportunity for swing traders and momentum investors.
BAKE (BakeryToken) remains an integral part of the DeFi and NFT landscape, particularly within the Binance Smart Chain ecosystem. Its utility, paired with renewed market attention and increased community engagement, could act as a fundamental driver behind this projected upward move. With the crypto market gradually rotating back into altcoins, BAKE could benefit from speculative capital flowing into undervalued DeFi assets.
Traders should keep a close watch on key resistance breakouts and continuation volume patterns. A confirmed daily candle close above the wedge resistance would further validate the bullish breakout thesis. Additionally, historical price action shows that BAKE has the potential to move sharply once momentum kicks in, offering a favorable risk-to-reward setup.
Overall, the technicals align well with rising investor sentiment. If the broader crypto environment stays supportive, BAKEUSDT could see a strong recovery rally in the short to mid term.
✅ Show your support by hitting the like button and
✅ Leaving a comment below! (What is You opinion about this Coin)
Your feedback and engagement keep me inspired to share more insightful market analysis with you!
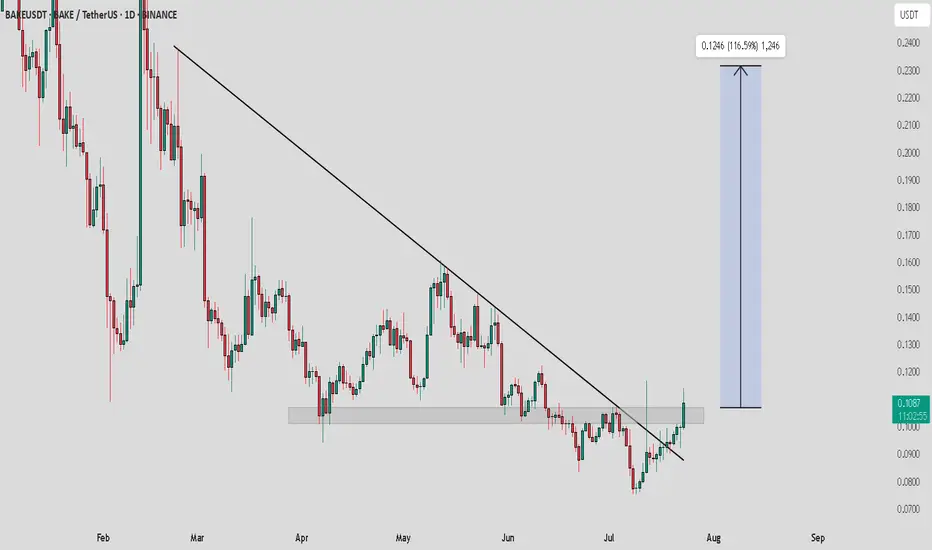
BAKE / USDT : Breakout PotentialBAKE/USDT - Breakout Potential
BAKE/USDT has recently broken above a key resistance zone and is attempting a trend reversal. With the trendline resistance already broken, we are expecting a bullish move towards the $0.124 target, which represents a potential gain of 116.5% from the current price.
Bullish Scenario:
Breakout above the resistance zone confirms the trend reversal, targeting $0.124 with a +116.5% upside.
Pro Tip:
Look for strong volume confirmation during the breakout. Set stop losses just below the breakout level for risk management.
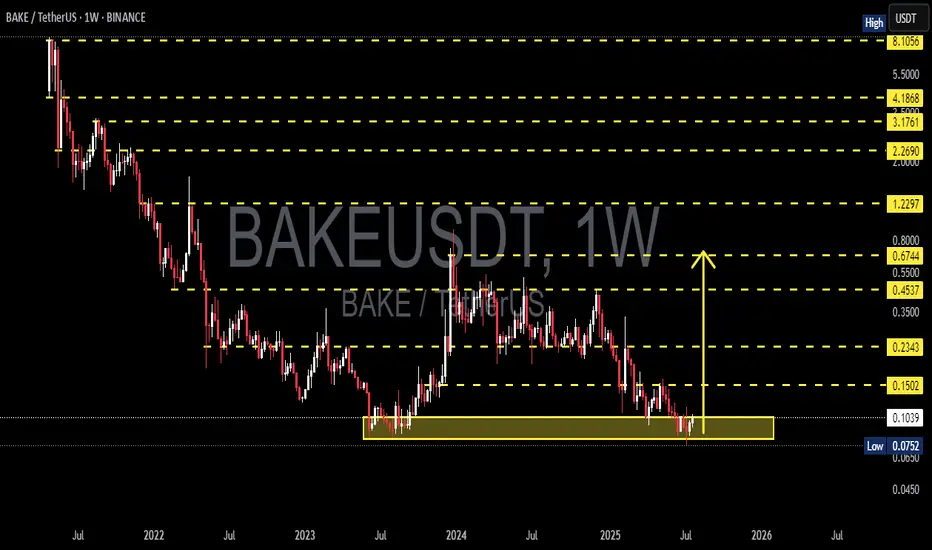
BAKEUSDT Weekly Analysis – Critical Level: Accumulation?🔎 Overview
BAKE/USDT is currently trading within a multi-year demand zone between $0.0752 and $0.1030, which has historically served as a strong support region since mid-2022. This zone has repeatedly triggered major price bounces, making it a high-interest area for traders and investors eyeing a potential trend reversal.
We're potentially witnessing a stealth accumulation phase — a quiet period where smart money begins to build positions before a markup phase, especially if rising volume starts to accompany price stabilization.
🧠 Technical Structure & Price Patterns
📌 Key Demand Zone Support
This zone ($0.0752–$0.1030) has held for nearly 3 years. Price has consistently bounced off this level, suggesting strong institutional or long-term holder interest.
📌 Potential Pattern: Inverse Head & Shoulders / Double Bottom
There's early indication of a potential inverse head and shoulders pattern forming.
Breakout above the neckline (~$0.15) would confirm a bullish reversal with measurable upside targets.
📌 Falling Channel Breakout Potential
BAKE has been moving inside a long-term descending channel. A breakout above the channel resistance could mark the beginning of a major trend shift.
📌 Volume Observation
Volume remains low, but this often precedes a strong move during accumulation. Watch for a volume spike to confirm breakout momentum.
📈 Bullish Scenario (Mid to Long-Term Reversal Potential)
If price holds above the demand zone and breaks through the first resistance at $0.15, the following targets come into play:
Target 1: $0.2343 – minor horizontal resistance
Target 2: $0.4537 – key April 2024 resistance level
Target 3: $0.6744 to $0.8000 – high-volume distribution zone
Extended Target: $1.2297 to $2.2690 – major supply area from early 2022
➡️ Upside potential exceeds +800% from the current levels if the reversal is confirmed.
📉 Bearish Scenario (Breakdown Continuation)
If BAKE breaks and closes below $0.0752, then:
A major structural breakdown would invalidate the accumulation thesis.
Price could drop toward the psychological support around $0.05 or even explore new all-time lows.
This could trigger a panic sell, especially among retail holders who rely heavily on this key level.
🧭 Strategic Takeaway
This zone represents a high-risk, high-reward opportunity.
Ideal for swing or long-term traders aiming to position early at undervalued levels.
However, avoid FOMO. Wait for clear breakout confirmation and volume surge before entering aggressively.
> “Smart money buys in silence — retail buys in headlines.”
#BAKEUSDT #AltcoinSetup #CryptoReversal #DemandZone #AccumulationPhase #BullishSetup #BearishScenario #SwingTradeCrypto #BAKEAnalysis
BAKE Bulls Targeting 0.105, +1692% Volume SurgeThe chart shows BAKEUSDT trading around 0.0898 USDT on Binance. Overall, the structure indicates that after a strong upward impulse from approximately 0.0835 USDT to 0.117 USDT, the price entered a correction and is now consolidating. This consolidation sits just above an important support level, signaling a possible preparation for the next leg up.
There is a clearly defined support area between 0.0835 and 0.0836 USDT, which has been tested multiple times. The most recent lows were bought up strongly, forming what looks like a potential double bottom or higher low, both common reversal patterns. Beneath this zone, the next deeper support rests near 0.0752 USDT, which would be considered only if the main support fails.
Overhead, the chart identifies resistance levels at 0.1050–0.1071 USDT, where price previously stalled and retraced. This zone aligns with the first target area for any bullish continuation. Further up, 0.1169 USDT marks the prior swing high and the most significant resistance to break for confirmation of a larger trend reversal.
Visually, the chart illustrates how the strong impulse rally was followed by a structured pullback, resembling an ABC correction pattern. The correction appears mature, as price action is tightening within a smaller range. This often suggests that momentum is getting ready to shift back upward if buying pressure sustains.
Several buy signals ("B") are marked on the chart near support zones, while sell signals ("S") have appeared near previous short-term peaks. The clustering of buy signals around the current levels reinforces the idea that traders have been accumulating positions in this area.
Below is the trading setup outlined on your chart:
• Entry Zone: Around 0.0898 USDT
• Stop Loss: Slightly under 0.0836 USDT to protect against a deeper retracement
• Take Profit Target: Between 0.1050 and 0.1071 USDT (initial target)
• Risk/Reward Ratio: Approximately 2.77, which is favorable for long positions
• Potential Gain: +17.69% from entry to target
• Potential Loss: -6.38% if the stop is hit
The highlighted risk/reward box shows the trade aims to capture a substantial move while limiting downside exposure.
The overall price behavior indicates that sellers failed to create new lows, and instead, the market printed a higher low above the key support zone. This is often one of the first signs that demand is absorbing supply and can set the stage for an upside breakout.
While volume data isn’t visible in the chart you shared, typically in this kind of setup, volume contracts during the correction phase and begins expanding again when price approaches a breakout point. Watching for rising volume on any move above 0.0900 USDT could confirm bullish intent.
If price breaks and closes above 0.0900 USDT on the hourly timeframe, this would be the first signal that momentum is flipping decisively in favor of the bulls. Ideally, you want to see a retest of this level hold as support, which would further validate the move. From there, a push into the 0.1050–0.1071 USDT resistance area becomes more probable. If this level is cleared on strong momentum, the extended target near 0.1169 USDT could be achievable.
In terms of sentiment, the fact that multiple buy signals have appeared near the support zone while sellers are absent near the lows reinforces a bullish bias. The risk is primarily centered around whether the 0.0835 USDT level holds. If price closes decisively below it, that would invalidate the current bullish thesis and potentially expose the market to a deeper drop toward the 0.0752 USDT support area.
Overall, the chart presents a constructive technical picture favoring further upside, provided that support holds and buyers can reclaim the short-term resistance above 0.0900 USDT. The consolidation phase appears to be maturing, and the combination of higher lows and consistent rejection of support zones increases the likelihood of a breakout.
Summary of the Bullish Scenario:
• The trend structure shows a strong impulse and controlled pullback.
• The price has respected a key support area repeatedly.
• Buy signals are clustered near the lows, suggesting accumulation.
• A breakout above 0.0900 USDT could trigger a rally toward 0.1050 USDT and potentially higher.
• The risk/reward profile is attractive, offering nearly 3 times the reward relative to the risk.

BAKEUSDT Forming Falling WedgeBAKEUSDT is currently forming a promising Falling Wedge Pattern, a classic bullish reversal setup that traders watch for significant upside potential. This pattern, combined with steadily increasing volume, indicates that a major breakout could be on the horizon. Historically, falling wedges often precede explosive price moves, and BAKEUSDT is showing early signs of preparing for just that. Technical traders who spot this formation early can position themselves for the expected 90% to 100%+ gain if the breakout confirms with strong momentum.
Investor sentiment around BAKEUSDT is improving as this project garners more attention from the crypto community. The sustained interest and accumulation phase within the wedge are clear signals that large buyers are preparing for a bigger move. As BAKEUSDT approaches the breakout point of the wedge, traders should closely monitor price action and volume spikes to catch the first wave of upward movement. This makes BAKE one of the top altcoins to keep on your radar right now.
Another reason BAKEUSDT stands out is its healthy trading volume, which supports the likelihood of a successful breakout rather than a false move. The increased liquidity ensures that once the resistance of the wedge pattern is breached, the price can rally with minimal slippage and strong follow-through. With major cryptocurrencies setting the tone for the broader market, high-potential altcoins like BAKE can benefit from renewed bullish momentum across the board.
✅ Show your support by hitting the like button and
✅ Leaving a comment below! (What is You opinion about this Coin)
Your feedback and engagement keep me inspired to share more insightful market analysis with you!
BAKEUSDT Approaching Breakout from Falling WedgeBAKEUSDT is currently trading near the upper resistance of a falling wedge pattern , often seen as a bullish reversal setup. With increasing volume and tighter price action, the market may be gearing up for a breakout. If confirmed, this could mark the beginning of a new upward trend. Traders should stay alert and wait for a clear breakout above resistance to validate the move.

BAKEUSDT 1D#BAKE is attempting to break out of the falling wedge on the daily chart.
Price briefly pierced above the wedge resistance with strong volume but has pulled back inside. If it manages to close a daily candle above the wedge with confirmation, it could trigger a bullish move toward the following targets:
🎯 $0.1069
🎯 $0.1266
🎯 $0.1425
🎯 $0.1583
🎯 $0.1809
🎯 $0.2001
⚠️ No confirmation yet — wait for a clean breakout with volume before entering.
⚠️ Always use a tight stop-loss and apply proper risk management.

BAKE/USDT 1-Day ChartThis 1-day chart shows a big drop from around 0.3400 to a low of 0.0752 recently, with a slight dip (-0.42%) today. A falling wedge pattern is forming—could mean a chance to bounce back! Plus, starting with the news, Binance added BAKE to its Monitoring Tag on July 7th, which usually signals higher risk. Oddly, the price went up instead—maybe the fear of delisting was already priced in, and the announcement not leading to immediate delisting sparked buying? Or there could be another factor at play!
CRUX:
Support Zone: A strong base is at 0.1200-0.1300, where buyers might step in.
Resistance Level: The next big test is at 0.1800-0.2000—break that, and it could rise!
Falling Wedge: This pattern, with its narrowing lines, often signals a bullish move if it breaks above 0.2000.
Momentum: The downtrend had steady volume, but the pattern hints at a possible upturn.
Timeframe:Watch the next few days for the wedge to break out.
Possibilities:
Bullish Move: A jump above 0.2000 with good volume could push it to 0.2500 or more!
Bearish Drop: A fall below 0.1200 might take it back to 0.0752—stay careful!
Safety Tip: Set a stop-loss below 0.1200 to stay safe.

$BAKE Trailing STOPHere is yet another trade on BYBIT:BAKEUSDT.P that pained me.
Not only that I followed it through the breakouts, I ate from the breakout after forming a rising wedge.
Then, I followed a ride back up immediately and had a sumptuous run too but when it started rallying and it was time for bed, I set a trailing stoploss to protect my profit. This stopped me out early before this major move Up.
I’m not angry as much because I protected not just my capital but profit.
But I’m still angry I didn’t win with the move that I foresaw.

BAKE ready to restart the uptrendhi traders,
Let's have a look at BAKEUSDT on the monthly time frame.
To be honest, there are not many altcoins that look as good as BAKE on the monthly.
Multiple months of the reaccumulation.
Support holds strong.
I can't see it to fail.
First target: 0,90
Second target: 1,62
BAKE is a low market-cap altcoin so I won't be surprised if the pump is fast and after that we will get a deep pullback again.
Good luck

$BAKEUSDT on it week upside candlestick on it all time low and also on it week upside strong orderblock

BAKEUSDT 1W AnalysisBAKE ~ 1W Analysis
#BAKE Buy back gradually from here with a short term target of at least 20%+ from this support.

BAKE - Amazing Signal gave us TOP 13.5% Profits.Just Wow.
Volume + Footprint allowed us to recognize market sentiment and movement change.
1️⃣ 1st Signal: We were waiting for a breakout from the Grey Triangle. Price broke down and retested the lower White Level (lower Edge) of the Triangle and dropped to POC. It was Like Textbook. My POC Level was Sniping 🎯. Insane accuracy 👌🎯😎 .
3.5 % 💰 💵 💲
2️⃣ 2nd Signal: 2 Days Later I updated the Same TA and gave a LONG as Signal.
I wrote: "eyes on Fib and 4h" .
Yellow Circle Marks. 👌🎯😎
Beautiful Reaction on that new 4h-LEvel + Fib 0.38.
AND BOOM💰💵💲 10 %
-- Below the link of both Original TA/Signals:
1st Signal:https://www.tradingview.com/chart/BAKEUSDT.P/QB8ppmBK-BAKE-Some-POIs/
2nd Signal:https://www.tradingview.com/x/B0j82o6D/
Follow for more ideas/Signals.💲
Just donate some of your profit to Animal rights or other charity :)✌️

BAKE - Some POIsThe Grey triangle could be a nice trade. Eyes on it.
I will be not active for next 1-2 days but here a small TA.
There is not much to say.
a quick overview of BAKE.
Follow for more ideas/Signals. 💲
Look at my other ideas 😉
Just donate some of your profit to Animal rights and rescue or other charity :)✌️

BAKEUSDT 1WBAKE ~ 1W Analysis
#BAKE Buy gradually from here if you still have a Conviction on this coin with a short -term target of at least 20%+.

BAKE - Some POIs that Blue box could be a nice short possibility.
Just wait until it reaches there then new small TA regarding Volume, then probably Short.
Follow for more ideas/Signals. 💲
Look at my other ideas 😉
Just donate some of your profit to Animal rights and rescue or other charity :)✌️

BAKEUSDT 1WBAKE ~ 1W Analysis
#BAKE Buy gradually from here if you still have a Conviction on this coin with a short -term target of at least 20%+.

BAKEUSDT – Red Boxes Are Strong Resistance Zones!The red boxes on BAKEUSDT represent significant resistance zones where we can expect considerable selling pressure. These levels have shown their strength in the past, and it's crucial to approach them with caution.
🔴 Key Insights:
Strong Resistance: The red boxes are key resistance areas with high potential for price rejection. Sellers are likely to be active here, so don’t rush.
Patience is Key: Always wait for lower time frame (LTF) breakouts with CDV and volume profile confirmation before making any decisions.
Avoid Blind Entries: Trading these zones blindly can be risky. Let the market show you its intention, and only trade with confirmation.
💡 Smart Approach:
Wait for a clear signal before making a move. If the market doesn’t break and retest these red zones with volume, there’s no reason to take unnecessary risks. Your entry should always be backed by proper data and analysis. Patience + Smart Entries = Successful Trades.
I keep my charts clean and simple because I believe clarity leads to better decisions.
My approach is built on years of experience and a solid track record. I don’t claim to know it all, but I’m confident in my ability to spot high-probability setups.
If you would like to learn how to use the heatmap, cumulative volume delta and volume footprint techniques that I use below to determine very accurate demand regions, you can send me a private message. I help anyone who wants it completely free of charge.
I have a long list of my proven technique below:
🎯 ZENUSDT.P: Patience & Profitability | %230 Reaction from the Sniper Entry
🐶 DOGEUSDT.P: Next Move
🎨 RENDERUSDT.P: Opportunity of the Month
💎 ETHUSDT.P: Where to Retrace
🟢 BNBUSDT.P: Potential Surge
📊 BTC Dominance: Reaction Zone
🌊 WAVESUSDT.P: Demand Zone Potential
🟣 UNIUSDT.P: Long-Term Trade
🔵 XRPUSDT.P: Entry Zones
🔗 LINKUSDT.P: Follow The River
📈 BTCUSDT.P: Two Key Demand Zones
🟩 POLUSDT: Bullish Momentum
🌟 PENDLEUSDT.P: Where Opportunity Meets Precision
🔥 BTCUSDT.P: Liquidation of Highly Leveraged Longs
🌊 SOLUSDT.P: SOL's Dip - Your Opportunity
🐸 1000PEPEUSDT.P: Prime Bounce Zone Unlocked
🚀 ETHUSDT.P: Set to Explode - Don't Miss This Game Changer
🤖 IQUSDT: Smart Plan
⚡️ PONDUSDT: A Trade Not Taken Is Better Than a Losing One
💼 STMXUSDT: 2 Buying Areas
🐢 TURBOUSDT: Buy Zones and Buyer Presence
🌍 ICPUSDT.P: Massive Upside Potential | Check the Trade Update For Seeing Results
🟠 IDEXUSDT: Spot Buy Area | %26 Profit if You Trade with MSB
📌 USUALUSDT: Buyers Are Active + %70 Profit in Total
🌟 FORTHUSDT: Sniper Entry +%26 Reaction
🐳 QKCUSDT: Sniper Entry +%57 Reaction
📊 BTC.D: Retest of Key Area Highly Likely
I stopped adding to the list because it's kinda tiring to add 5-10 charts in every move but you can check my profile and see that it goes on..
A tiny part of my runners;
🌊 WAVESUSDT.P: Demand Zone Potential
🟣 UNIUSDT.P: Long-Term Trade
🔵 XRPUSDT.P: Entry Zones
🔗 LINKUSDT.P: Follow The River
📈 BTCUSDT.P: Two Key Demand Zones
A tiny part of my runners;
💼 STMXUSDT: 2 Buying Areas
🐢 TURBOUSDT: Buy Zones and Buyer Presence
🌍 ICPUSDT.P: Massive Upside Potential | Check the Trade Update For Seeing Results
🟠 IDEXUSDT: Spot Buy Area | %26 Profit if You Trade with MSB
📌 USUALUSDT: Buyers Are Active + %70 Profit in Total
🌟 FORTHUSDT: Sniper Entry +%26 Reaction
🐳 QKCUSDT: Sniper Entry +%57 Reaction
j
📌I keep my charts clean and simple because I believe clarity leads to better decisions.
📌My approach is built on years of experience and a solid track record. I don’t claim to know it all but I’m confident in my ability to spot high-probability setups.
📌If you would like to learn how to use the heatmap, cumulative volume delta and volume footprint techniques that I use below to determine very accurate demand regions, you can send me a private message. I help anyone who wants it completely free of charge.
🔑I have a long list of my proven technique below:
🎯 ZENUSDT.P: Patience & Profitability | %230 Reaction from the Sniper Entry
🐶 DOGEUSDT.P: Next Move
🎨 RENDERUSDT.P: Opportunity of the Month
💎 ETHUSDT.P: Where to Retrace
🟢 BNBUSDT.P: Potential Surge
📊 BTC Dominance: Reaction Zone
🌊 WAVESUSDT.P: Demand Zone Potential
🟣 UNIUSDT.P: Long-Term Trade
🔵 XRPUSDT.P: Entry Zones
🔗 LINKUSDT.P: Follow The River
📈 BTCUSDT.P: Two Key Demand Zones
🟩 POLUSDT: Bullish Momentum
🌟 PENDLEUSDT.P: Where Opportunity Meets Precision
🔥 BTCUSDT.P: Liquidation of Highly Leveraged Longs
🌊 SOLUSDT.P: SOL's Dip - Your Opportunity
🐸 1000PEPEUSDT.P: Prime Bounce Zone Unlocked
🚀 ETHUSDT.P: Set to Explode - Don't Miss This Game Changer
🤖 IQUSDT: Smart Plan
⚡️ PONDUSDT: A Trade Not Taken Is Better Than a Losing One
💼 STMXUSDT: 2 Buying Areas
🐢 TURBOUSDT: Buy Zones and Buyer Presence
🌍 ICPUSDT.P: Massive Upside Potential | Check the Trade Update For Seeing Results
🟠 IDEXUSDT: Spot Buy Area | %26 Profit if You Trade with MSB
📌 USUALUSDT: Buyers Are Active + %70 Profit in Total
🌟 FORTHUSDT: Sniper Entry +%26 Reaction
🐳 QKCUSDT: Sniper Entry +%57 Reaction
📊 BTC.D: Retest of Key Area Highly Likely
📊 XNOUSDT %80 Reaction with a Simple Blue Box!
📊 BELUSDT Amazing %120 Reaction!
I stopped adding to the list because it's kinda tiring to add 5-10 charts in every move but you can check my profile and see that it goes on..
