BANDUSDT UPDATEBANDUSDT is forming a clear falling wedge pattern, a classic bullish reversal signal that often indicates an upcoming breakout. The price has been consolidating within a narrowing range, suggesting that selling pressure is weakening while buyers are beginning to regain control. With consistent volume confirming accumulation at lower levels, the setup hints at a potential bullish breakout soon. The projected move could lead to an impressive gain of around 90% to 100% once the price breaks above the wedge resistance.
This falling wedge pattern is typically seen at the end of downtrends or corrective phases, and it represents a potential shift in market sentiment from bearish to bullish. Traders closely watching BANDUSDT are noting the strengthening momentum as it nears a breakout zone. The good trading volume adds confidence to this pattern, showing that market participants are positioning early in anticipation of a reversal.
Investors’ growing interest in BANDUSDT reflects rising confidence in the project’s long-term fundamentals and current technical strength. If the breakout confirms with sustained volume, this could mark the start of a fresh bullish leg. Traders might find this a valuable setup for medium-term gains, especially as the wedge pattern completes and buying momentum accelerates.
✅ Show your support by hitting the like button and
✅ Leaving a comment below! (What is your opinion about this Coin?)
Your feedback and engagement keep me inspired to share more insightful market analysis with you!
Trade ideas

BANDUSDT 1D#BAND has broken above the descending resistance with strong volume on the daily chart. It may face a small pullback as it approaches the daily SMA50, potentially retesting the broken trendline. In case of a successful bounce, the targets are:
🎯 $0.539
🎯 $0.656
🎯 $0.750
🎯 $0.844
🎯 $0.979
⚠️ Always remember to use a tight stop-loss and maintain proper risk management.

#BAND/USDT Bulls Maintain this Momentum or Will Bears Win?#BAND
The price is moving in a descending channel on the 1-hour timeframe. It has reached the lower boundary and is heading towards breaking above it, with a retest of the upper boundary expected.
We have a downtrend on the RSI indicator, which has reached near the lower boundary, and an upward rebound is expected.
There is a key support zone in green at 0.426. The price has bounced from this zone multiple times and is expected to bounce again.
We have a trend towards stability above the 100-period moving average, as we are moving close to it, which supports the upward movement.
Entry price: 0.432
First target: 0.447
Second target: 0.464
Third target: 0.483
Don't forget a simple principle: money management.
Place your stop-loss order below the green support zone.
For any questions, please leave a comment.
Thank you.

BANDUSDT UPDATE#BAND
UPDATE
BAND Technical Setup
Pattern: Falling Wedge Pattern
Current Price: $0.448
Target Price: $0.584
Target % Gain: 149.72%
Technical Analysis: BAND is breaking out of a falling wedge pattern on the 1D chart, signaling a bullish reversal after a prolonged downtrend. Price has compressed between descending trendlines and has now pushed above the wedge resistance with strong momentum. The breakout structure suggests continuation to the upside, with the projected target derived from the height of the wedge pointing toward the highlighted resistance zone. Sustained price action above the breakout area strengthens the bullish setup.
Time Frame: 1D
Risk Management Tip: Always use proper risk management.

#BAND/USDT Bulls Maintain this Momentum or Will Bears Win?#BAND
The price is moving within a descending channel on the 1-hour frame, adhering well to it, and is heading for a strong breakout and retest.
We have a bearish trend on the RSI indicator that is about to be broken and retested, which supports the upward breakout.
There is a major support area in green at 0.522, representing a strong support point.
We are heading for consolidation above the 100 moving average.
Entry price: 0.550
First target: 0.600
Second target: 0.677
Third target: 0.767
Don't forget a simple matter: capital management.
When you reach the first target, save some money and then change your stop-loss order to an entry order.
For inquiries, please leave a comment.
Thank you.

BANDUSDT: trend in daily time framesThe color levels are very accurate levels of support and resistance in different time frames, and we have to wait for their reaction in these areas.
So, Please pay special attention to the very accurate trend, colored levels, and you must know that SETUP is very sensitive.
Be careful
BEST
MT

Can #BAND Bulls Maintain this Momentum or Will Bears Win? Yello, Paradisers! Is #BANDProtocol breakout from the falling wedge legit—or are bulls walking straight into a trap? Let's dig into the latest setup of #BANDUSDT:
💎After trading for weeks inside a falling wedge, #BAND has finally broken out with solid momentum. The breakout above the resistance trendline at around $0.66 has already occurred, and the price is currently hovering near the $0.72 zone. While this move is promising, it’s now all about whether this breakout can hold or fake out.
💎The structure here is clear: #BANDUSD reclaimed the demand zone between $0.60–$0.66 after bouncing off strong support at $0.504. This zone now becomes the most important area to watch in the short term. A retest of this level would offer a high-probability continuation setup, especially since the 50EMA is now acting as dynamic support beneath the price.
💎If bulls can maintain control, we have a clear path toward the moderate resistance at $0.992. That’s where the next wave of selling pressure is expected. But the real prize is the strong resistance zone near $1.180. That’s the level where major distribution could occur, and it's where we’ll be watching closely for profit-taking signs.
💎However, the bullish thesis breaks down completely if the price drops back below the $0.60–$0.66 demand zone. In that case, our invalidation point sits firmly at $0.504. A close below that support would indicate bears are back in control, and we’d shift to a defensive stance, targeting lower re-entry zones.
Stay patient, Paradisers. Let the breakout confirm, and only then do we strike with conviction.
MyCryptoParadise
iFeel the success🌴

BAND/USDT - Inverse H&SOn the 4H timeframe, BAND has formed a clear inverse Head & Shoulders pattern, signaling a potential bullish reversal. The breakout is already confirmed, with momentum building above the neckline.
The pattern projection suggests a first target at $1.00, which aligns with key resistance. A sustained move above this level could open the way for a larger continuation rally, positioning BAND for a much bigger bullish leg.

BAND (SPOT)BINANCE:BANDUSDT
#BAND/ USDT
Entry range (0.730- 0.720)
SL 4H close below 0.681
T1 0.99
_______________________________________________________
Golden Advices.
********************
* collect the coin slowly in the entry range.
* Please calculate your losses before the entry.
* Do not enter any trade you find it not suitable for you.
* No FOMO - No Rush , it is a long journey.

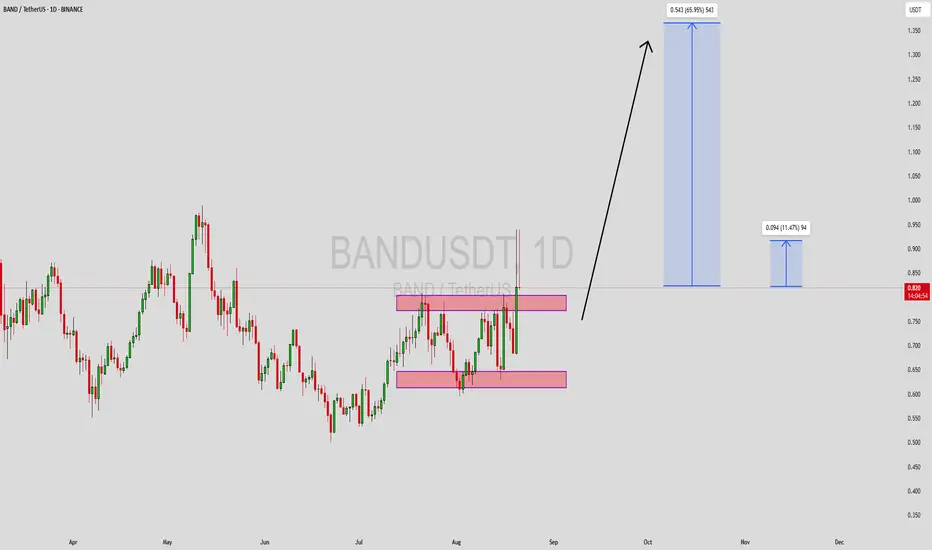
BANDUSDT Forming Potential BreakoutBANDUSDT is currently trading within a well-defined accumulation range and is showing signs of a potential breakout from key resistance. The chart reflects a consolidation pattern with a strong support base forming near the $0.65 zone, and resistance building near the $0.80 level. With increased volume and renewed buying pressure, this setup hints at an incoming bullish move targeting gains of 50% to 60%+ in the near term.
The structure on the daily timeframe indicates that BAND is primed for a trend reversal. Multiple rejections from the support zone followed by higher lows suggest that buyers are steadily gaining control. A clean breakout above the upper range could trigger a significant rally, and the upside potential shown in the projection is supported by the volume buildup. This makes BAND an attractive pick for swing traders and mid-term investors watching for breakout confirmations.
Investor sentiment appears to be shifting positively towards BAND as it's regaining traction in the broader altcoin market. The recent price behavior indicates growing interest, and if momentum continues to build, this pair could outperform many peers during the upcoming wave. A confirmed breakout could place BAND on the radar of major players looking for undervalued assets with strong upside potential.
✅ Show your support by hitting the like button and
✅ Leaving a comment below! (What is You opinion about this Coin)
Your feedback and engagement keep me inspired to share more insightful market analysis with you!
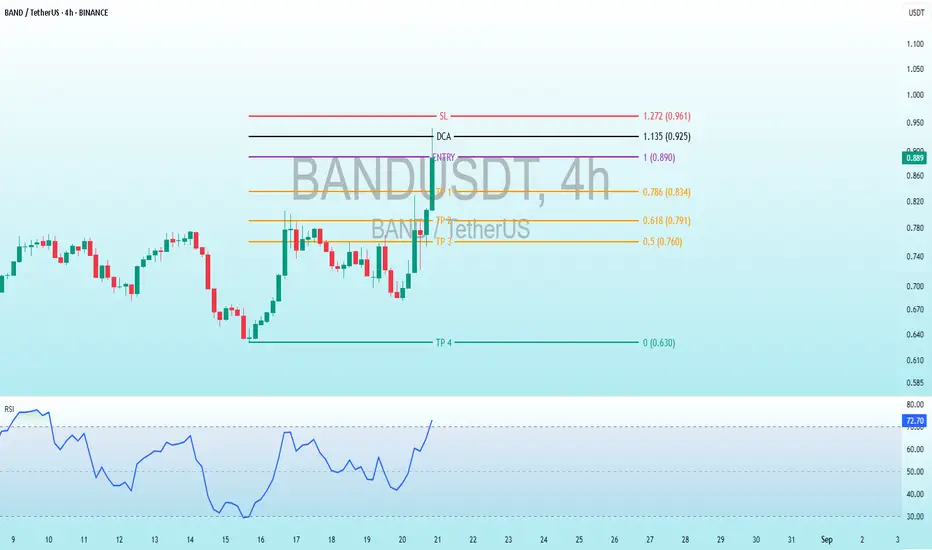
$BAND 4H Analysis: Bearish Targets with SL, DCA, and TP LevelsBINANCE:BANDUSDT
Support and Resistance:
SL (Stop Loss): 1.272 (0.961 USDT) – A potential level to exit if the price moves against the trade.
DCA (Dollar-Cost Averaging): 1.135 (0.925 USDT) – A level for adding to the position if the price drops.
ENTRY 1 ( 0.890 - 0.880 USDT)
TP1 (Take Profit 1): 0.786 (0.834 USDT)
TP2: 0.618 (0.791 USDT)
TP3: 0.5 (0.760 USDT)
TP4: 0 (0.630 USDT) – These are potential profit-taking levels if the price moves downward.
The chart shows a recent downward trend with a sharp drop, followed by a potential reversal or consolidation near the Entry level.
Technical IndicatorsRSI (Relative Strength Index): The bottom panel shows the RSI, which is currently around 72.13. This indicates the asset is in overbought territory (above 70), suggesting a potential reversal or pullback might occur soon unless bullish momentum continues.
Trading StrategyThe chart outlines a bearish strategy with multiple take-profit levels (TP1 to TP4) below the current price, indicating an expectation of further decline.
The Entry at 0.890 - 0.880 USDT suggests a short position or a buy-the-dip opportunity depending on the trader’s intent.
The DCA level at 0.925 USDT allows for averaging down if the price retraces upward slightly.
The SL at 0.961 USDT provides a risk management level to limit losses.
ObservationsThe price action shows volatility with significant red (bearish) candles recently, aligning with the bearish TP targets.
The RSI being overbought could signal a short-term correction, which might test the SL or DCA levels before continuing downward.
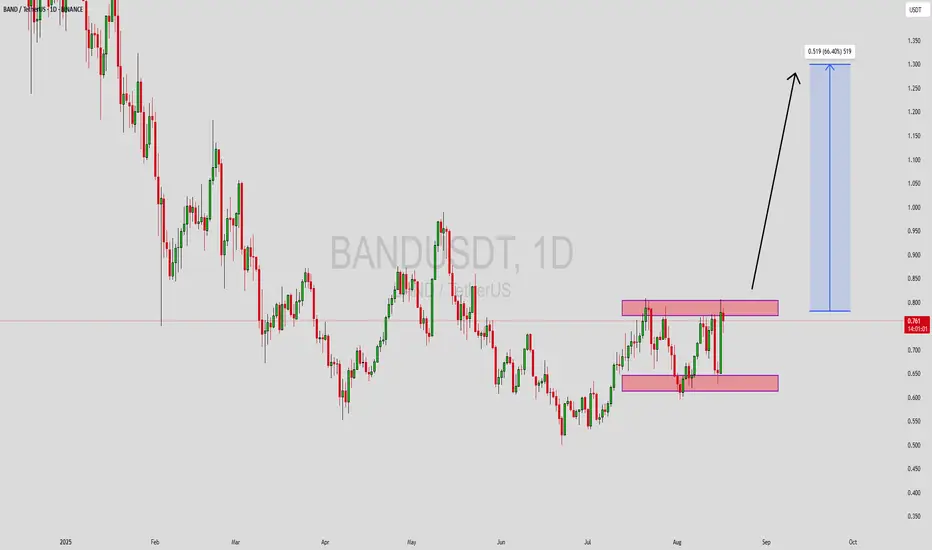
BANDUSDT Forming Potential BreakoutBANDUSDT is currently trading within a well-defined accumulation range and is showing signs of a potential breakout from key resistance. The chart reflects a consolidation pattern with a strong support base forming near the $0.65 zone, and resistance building near the $0.80 level. With increased volume and renewed buying pressure, this setup hints at an incoming bullish move targeting gains of 50% to 60%+ in the near term.
The structure on the daily timeframe indicates that BAND is primed for a trend reversal. Multiple rejections from the support zone followed by higher lows suggest that buyers are steadily gaining control. A clean breakout above the upper range could trigger a significant rally, and the upside potential shown in the projection is supported by the volume buildup. This makes BAND an attractive pick for swing traders and mid-term investors watching for breakout confirmations.
Investor sentiment appears to be shifting positively towards BAND as it's regaining traction in the broader altcoin market. The recent price behavior indicates growing interest, and if momentum continues to build, this pair could outperform many peers during the upcoming wave. A confirmed breakout could place BAND on the radar of major players looking for undervalued assets with strong upside potential.
✅ Show your support by hitting the like button and
✅ Leaving a comment below! (What is You opinion about this Coin)
Your feedback and engagement keep me inspired to share more insightful market analysis with you!
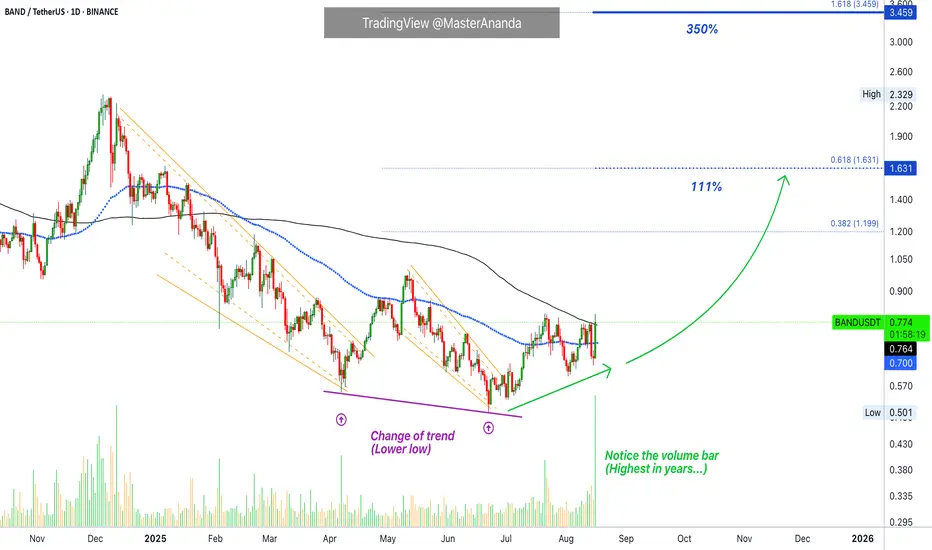
Band Protocol Bullish · What About Bitcoin?I would like to remind you that the altcoins market is ultra bullish now. Many of the top projects are trading near support. Not at true bottom prices, the bottom is gone, but still relatively low. Soon, in a matter of weeks, everything will change and low prices will be a thing of the past.
BANDUSDT is moving today above EMA89 and MA200 simultaneously. At the same time we have the highest daily (buy) volume ever on the chart. Strong buying happening as BANDUSDT breaks above a major resistance level. This is a powerful bullish signal. It is as clear as day.
With this little information we now know that BANDUSDT is going up. We have two targets here, easy hit, 111% and 350%. Time horizon for these is always 1-3 months, mid-term.
Don't worry about Bitcoin, retraces, corrections and the short-term, this will not change what is about to happen to the altcoins market and this is where we trade. If Bitcoin drops, it is something meant for the short-term. It will recover and it will continue growing, as Bitcoin grows, the rest of the market does the same. We are going up.
Thank you for reading.
Namaste.
BANDUSDT 1D#BAND has broken above the descending resistance and the SMA100 on the daily chart. In case of a successful retest, the targets are:
🎯 $0.923
🎯 $1.053
🎯 $1.183
🎯 $1.369
⚠️ Always use a tight stop-loss and apply proper risk

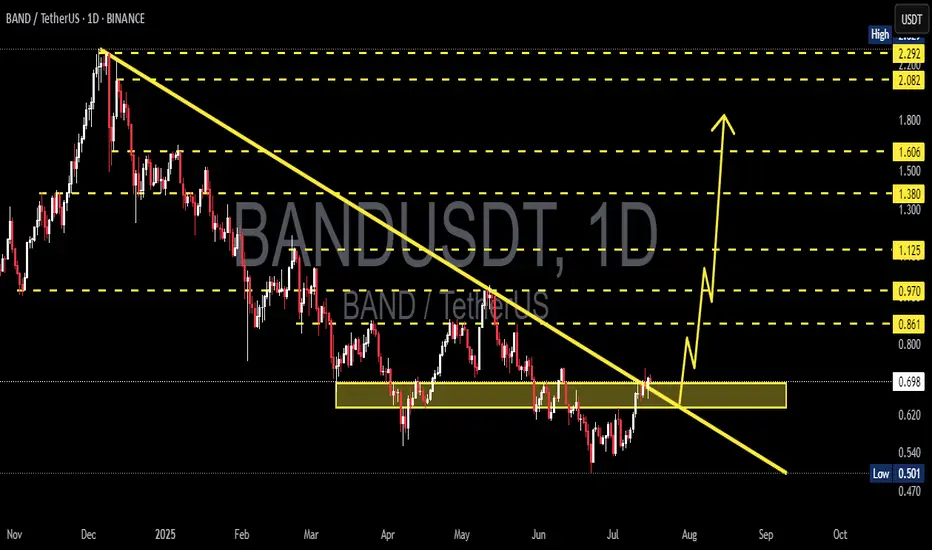
BAND/USDT – Massive Trendline Breakout! Reversal Play!📌 Chart Overview:
BAND/USDT has officially broken out from a long-term descending trendline that has suppressed price action for over 7 months. This breakout, confirmed with a bullish daily close above a key horizontal resistance zone ($0.68–$0.70), opens the door for a powerful trend reversal.
The structure signals the end of accumulation and the beginning of a potential markup phase, where volatility and volume often expand rapidly.
🔍 Technical Pattern Breakdown:
Falling Wedge Formation: A classic bullish reversal pattern formed after a prolonged downtrend. The wedge narrowed price volatility and concluded with a clean breakout to the upside.
Descending Trendline Breakout: The break of the major trendline marks a shift in control from bears to bulls. Historically, this is one of the strongest technical signals for a trend reversal.
Demand Zone Validation: The $0.60–$0.70 range has acted as a multi-month accumulation zone, with repeated rejections from the downside showing strong buyer presence.
✅ Bullish Scenario:
If BAND holds above the $0.68–$0.70 breakout zone, a strong bullish rally could unfold with the following upside targets:
1. TP1: $0.861 – Minor resistance, potential retest level.
2. TP2: $0.970 – Psychological resistance and historical flip zone.
3. TP3: $1.125 – Major horizontal resistance; a breakout from here could trigger FOMO buying.
4. TP4: $1.380–$1.606 – High-confluence zone from previous consolidation.
5. TP5: $2.08–$2.29 – Ultimate extension target aligned with macro resistance from November 2024 highs.
Each breakout above the target levels could lead to a short squeeze scenario, accelerating momentum.
⚠️ Bearish Scenario:
A failure to sustain above the $0.68–$0.70 level would invalidate the breakout and trap late buyers.
Breakdown back below the yellow zone could push price towards:
$0.60 – Key mid-support
$0.501 – The lowest support on chart; a break here would resume the downtrend.
Watch for volume divergence or fake-out signals on lower timeframes.
🧠 Market Psychology Insight:
This setup reflects a shift in sentiment. After a prolonged phase of apathy and seller exhaustion, smart money appears to be stepping in. The strong rejection from lows and breakout suggests early-stage bullish accumulation transitioning into public participation.
If volume increases along with upward price movement, it may confirm Phase C-D of a Wyckoff Accumulation, suggesting much higher upside.
📆 Timing Note:
Historically, July–September has offered volatility surges across mid-cap altcoins. With BAND breaking structure at this critical timing, early positioning could offer asymmetrical risk-reward.
#BANDUSDT #CryptoBreakout #AltcoinSeason #TrendlineBreak #BullishReversal #TechnicalAnalysis #FallingWedge #CryptoSignals #BANDToken #CryptoTA
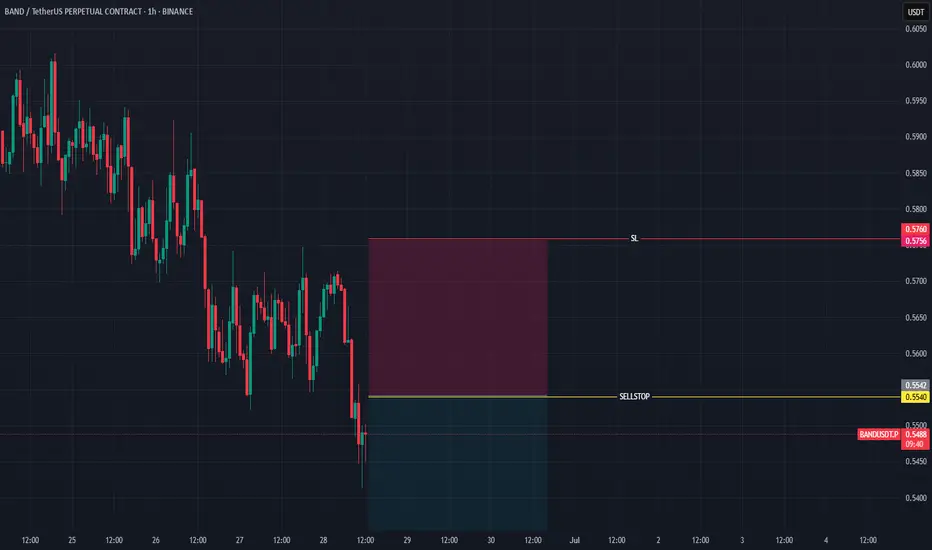
BANDUSDTBearish Trend continuation
SellStop and SL are mention on the chart
Note: Please move your SL to EP after TP1

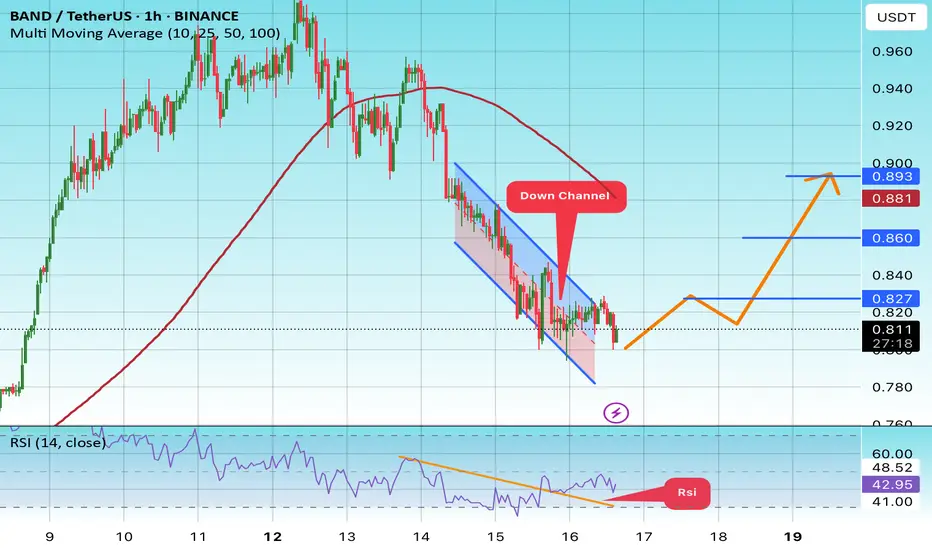
#BAND/USDT#BAND
The price is moving within a descending channel on the 1-hour frame and is expected to break and continue upward.
We have a trend to stabilize above the 100 moving average once again.
We have a downtrend on the RSI indicator that supports the upward move with a breakout.
We have a support area at the lower limit of the channel at 0.04400, which acts as strong support from which the price can rebound.
Entry price: 0.810
First target: 0.827
Second target: 0.860
Third target: 0.893
BANDUSDT 1D AnalysisBAND ~ 1D Analysis
#BAND Buy when re -testing this support block with a short -term target of at least 15%+ from here.


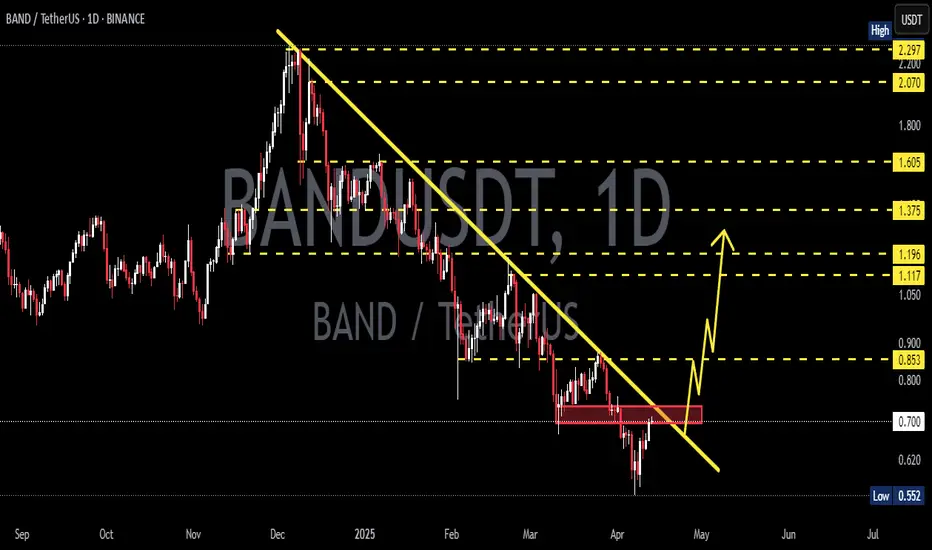
BANDUSDT 1DBAND ~ 1D Analysis
#BAND Buy after successfully penetrating this resistant line with a short -term target of at least 10%+.
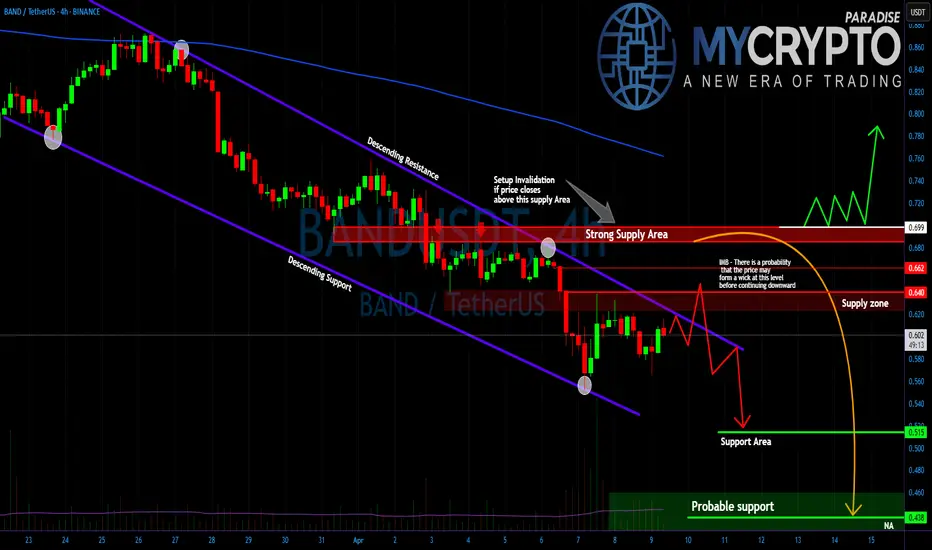
BANDUSDT Breakdown or Reversal?
Yello, Paradisers. Have you been watching #BAND lately? The setup is tightening, and it’s only a matter of time before a major move plays out one that could trap both early bulls and stubborn bears. The key now is preparation, not prediction.
💎#BANDUSDT continues to move within a clean descending channel, respecting both trendline resistance and support. The broader structure shows a clear downtrend, and at this stage, there's a strong probability that price may first push upward with a wick to fill an existing imbalance only to reject and continue lower. These kinds of deceptive moves are common during market weakness and are often designed to trap breakout traders before the real direction is confirmed.
💎#BAND price remains firmly below both the 50 and 200 exponential moving averages, which confirms that the larger trend is still bearish. The 50 EMA is currently acting as dynamic resistance, capping any short-term upside attempts. Meanwhile, the 200 EMA adds further weight to the bearish case, as price has consistently failed to reclaim or hold above it.
💎The most important level to the upside is 0.699. This is a clear supply zone, and unless the price can break and sustain above this level and reclaim both EMAs there will be no real shift in market sentiment. On the downside, 0.515 remains a critical support level. If price holds here, a short-term bounce is possible. However, if 0.515 breaks with momentum, the next key downside target becomes 0.438, marking a deeper markdown phase.
Stay focused, Paradisers. Be the hunter, not the hunted.
MyCryptoParadise
iFeel the success🌴
BANDUSDT: trend in 4-H time framesThe color levels are very accurate levels of support and resistance in different time frames, and we have to wait for their reaction in these areas.
So, Please pay special attention to the very accurate trend, colored levels, and you must know that SETUP is very sensitive.
Be careful
BEST
MT
