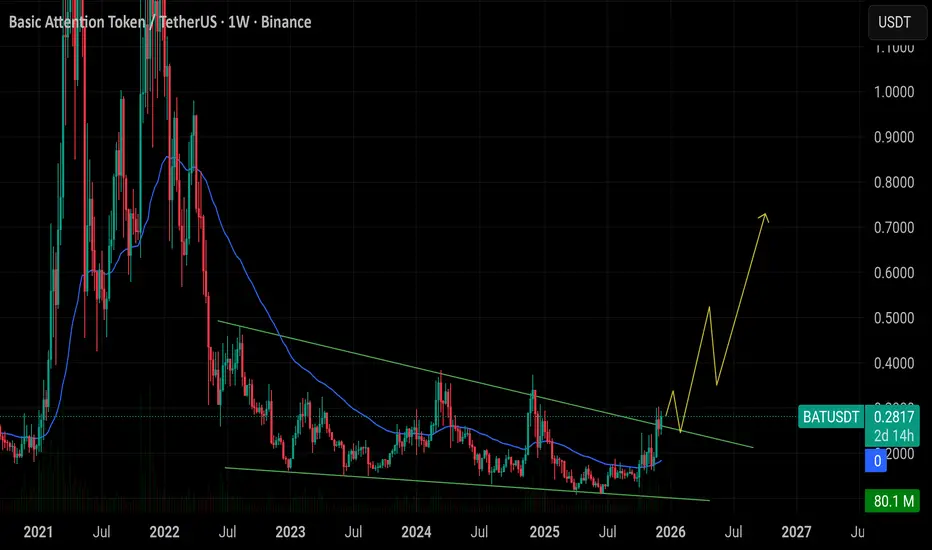
BAT - Is This the Start of a Bigger Continuation?📈BAT has been steadily shifting from accumulation into a clear bullish structure , forming higher lows and pressing back into the major resistance from earlier this quarter.
⚔️Price is now retesting the red breakout level, which previously acted as resistance during the correction phase.
As long a

BAT Analysis (1D)The structure of BAT is bullish, but we should not forget that it is approaching a key level.
BAT is getting close to a strong liquidity pool.
If price reaches the LP zone, we will look for sell / short positions toward the marked targets.
A daily candle close above the invalidation level will in

BAT is getting close to the buyers' zone (3D)After multiple drops, it seems that BAT is getting close to a strong support level. In this zone, it is possible to buy gradually in spot.
The targets are indicated on the chart.
The closure of a daily candle below the invalidation level will invalidate this analysis.
Do not enter the position wi

$BAT finally pushed through the descending channel 🚨🚨🚨✅ BITMEX:BAT finally pushed through the descending channel and is holding above 0.25. As long as it holds above 0.25, the breakout stays valid and the upside targets stay in play. That level is the line that keeps the momentum alive. If buyers defend it on the next retest, the move can stretch q
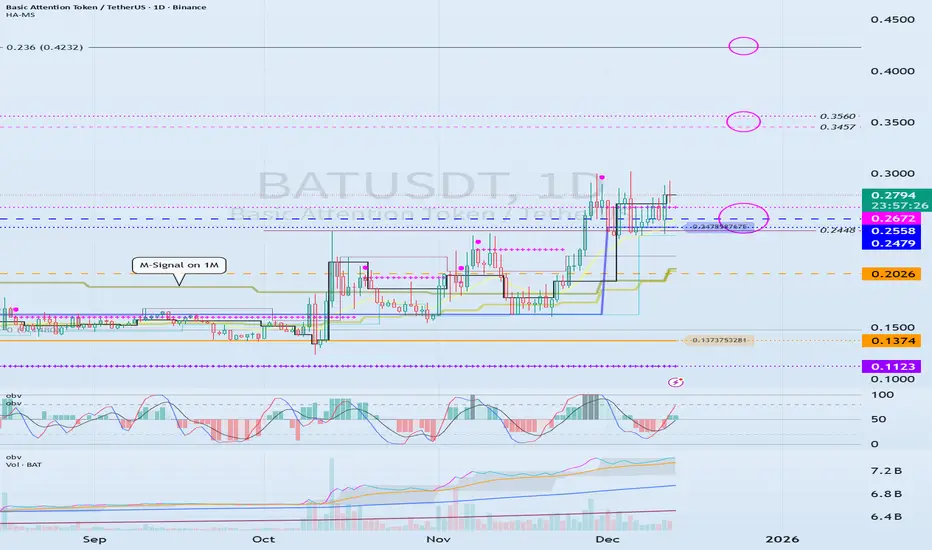
See if it can rally after holding support at 0.2558-0.2672
Hello, fellow traders!
Follow us to get the latest updates quickly.
Have a great day!
-------------------------------------
(BATUSDT 1M Chart)
After a significant decline, the price is forming a close above the M-Signal indicator on the 1M chart.
Accordingly, if the price remains above the M-S
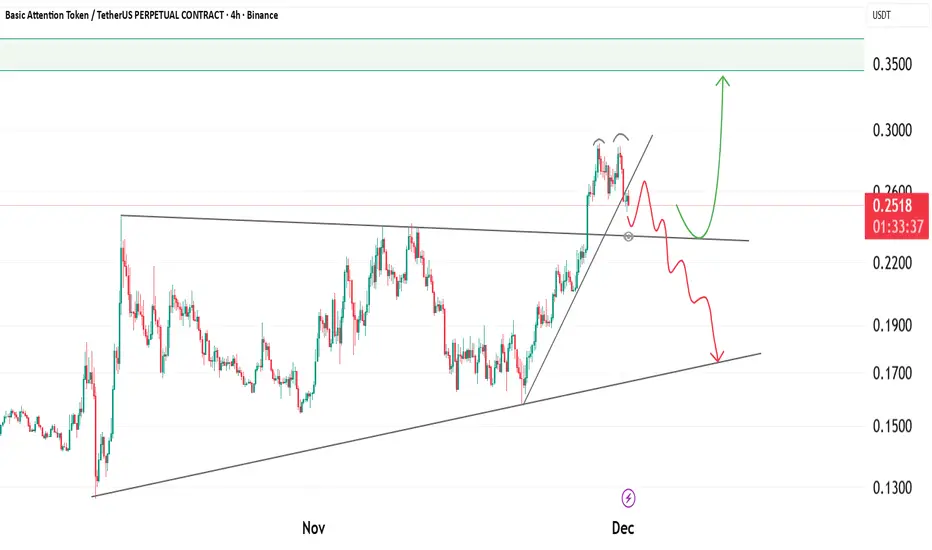
BAT – Decision Point Ahead as Structure TightensBAT is approaching a critical decision zone as price moves within a tightening structure. After a strong impulsive leg upward, the market is now forming a potential topping pattern while sitting directly on the trendline support.
The current behaviour shows two possible scenarios depending on how
BATUSDT Forming Bullish MomentumBATUSDT is forming a clear bullish momentum pattern, a classic bullish reversal signal that often indicates an upcoming breakout. The price has been consolidating within a narrowing range, suggesting that selling pressure is weakening while buyers are beginning to regain control. With consistent vol
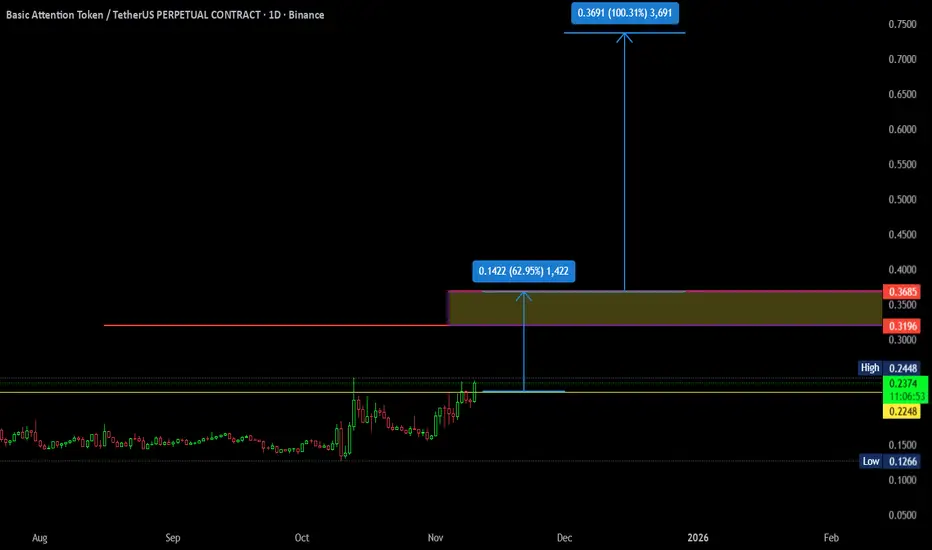
Market Makers Exposed : BAT VWAP Structure Points to 0.36The volume is the source, the price is the advertiser, and the time is the regulator and all three are currently aligned.
👉The highlighted box represents the price expected on November 30, 23:59.
This move is not random. It is simply price reacting to volume and VWAP structure.

$BAT/USDT Analysis - VWAP-BasedThis analysis is based on VWAP (Volume Weighted Average Price) using monthly and daily charts.
Key Points:
- VWAP levels indicate significant support and resistance zones.
- The highlighted box represents the price expected on November 30 (note: November has 30 days, not 31).
- A daily close above
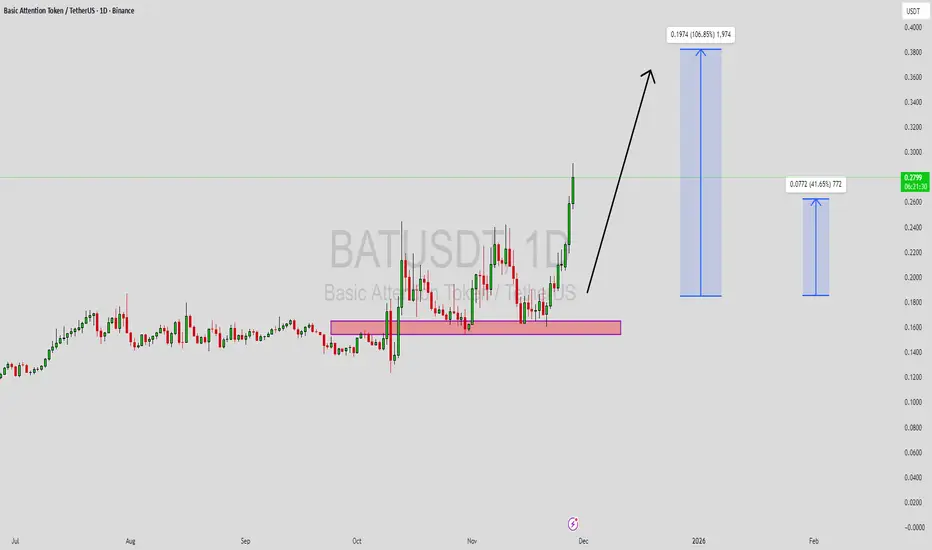
strong bullish momentum and increased volumereclaiming a key support level, buyers have shown clear control, forming a higher low structure. I expect continuation to the upside as long as price holds above the breakout zone. My entry is positioned on the retest, with the stop below the recent swing low and the target aligned with the next res

See all ideas
Summarizing what the indicators are suggesting.
Oscillators
Neutral
SellBuy
Strong sellStrong buy
Strong sellSellNeutralBuyStrong buy
Oscillators
Neutral
SellBuy
Strong sellStrong buy
Strong sellSellNeutralBuyStrong buy
Summary
Neutral
SellBuy
Strong sellStrong buy
Strong sellSellNeutralBuyStrong buy
Summary
Neutral
SellBuy
Strong sellStrong buy
Strong sellSellNeutralBuyStrong buy
Summary
Neutral
SellBuy
Strong sellStrong buy
Strong sellSellNeutralBuyStrong buy
Moving Averages
Neutral
SellBuy
Strong sellStrong buy
Strong sellSellNeutralBuyStrong buy
Moving Averages
Neutral
SellBuy
Strong sellStrong buy
Strong sellSellNeutralBuyStrong buy
Displays a symbol's price movements over previous years to identify recurring trends.