HCA Healthcare I observe a clear rotation of capital into the healthcare sector, with strong inflows toward medical companies reporting solid earnings and outlooks. Within this rotation, HCA Healthcare appears to be the most attractively valued company, supported by consistent profitability, a strong balance sheet
HCA Healthcare Inc Shs Unsponsored Brazilian Depositary Receipt Repr 0.05 Sh
No trades
16,478.38
0.01 BRL
31.05 B BRL
380.62 B BRL
About HCA Healthcare, Inc.
Sector
Industry
CEO
Samuel N. Hazen
Website
Headquarters
Nashville
Founded
1968
ISIN
BRH1CABDR002
FIGI
BBG00R28TYY7
HCA Healthcare, Inc. is a health care services company engaged in operating hospitals, freestanding surgery centers and emergency care facilities, urgent care facilities, walk-in clinics, diagnostic and imaging centers, radiation and oncology therapy centers, comprehensive rehabilitation and physical therapy centers, physician practices, home health, hospice, outpatient physical therapy home and community-based services providers, and various other facilities. The firm operates general and acute care hospitals that offer medical and surgical services, including inpatient care, intensive care, cardiac care, diagnostic, and emergency services, and outpatient services, such as outpatient surgery, laboratory, radiology, respiratory therapy, cardiology, and physical therapy. The company was founded by Dr. Thomas F. Frist, Jr in 1968 and is headquartered in Nashville, TN.
Related stocks

HCA - Precision Swing Long (Consistent Technical Alignment)🎯 Ticker: HCA (NYSE)
📈 Type: Swing Long
⏰ Timeframe: Daily (D1) & 4H
📊 Multi-Timeframe Technical Analysis:
Daily Trend: BULLISH ✅
Technical Alignment: BUY Signals Across All Timeframes (Daily, 4H, 1H)
Key Support: $450-455 zone (Confluence of SMA 20 & previous resistance)
Momentum: RSI (57.6) sh

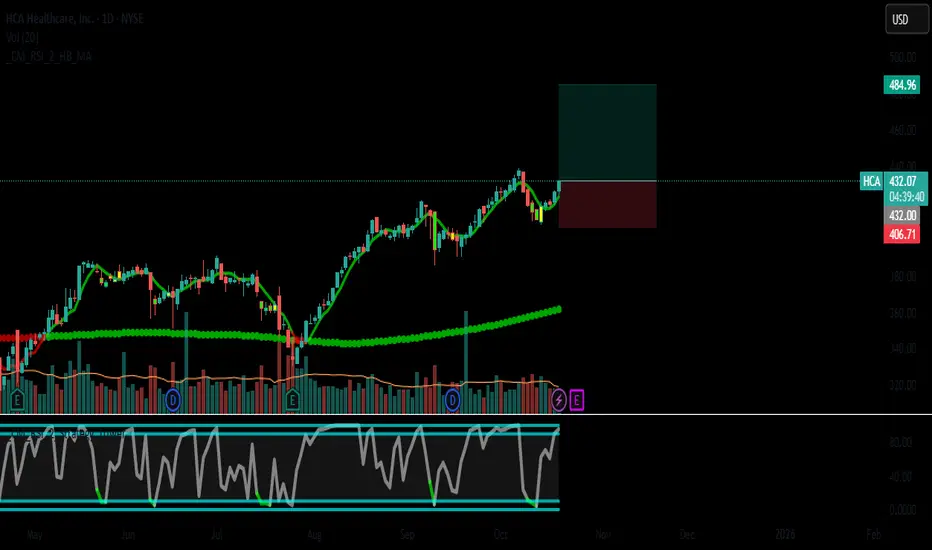
HCA - High-Probability Swing Trade with Connors ConfirmationHCA - HCA Healthcare, Inc.
🏥 Strong Buy Signal | Confirmed by Fundamentals, Technicals & Connors RSI2
🎯 Trade Idea Overview
Direction: LONG
Entry Zone: $429 - $433
Stop Loss: $406.70
Take Profit: $484.96
Strategy: Swing to Position Trade (2–6 weeks)
Confidence Level: High (85%)
📊 Why HCA?
✅ F
HCA Healthcare | HCA | Long at $299.00NYSE:HCA Healthcare: P/E of 13x, earnings are forecast to grow 6.01% per year; earnings have grown 10.6% per year over the past 5 years, and trading at good value compared to peers and industry.
From a technical analysis perspective, it dipped to my selected historical simple moving average area a

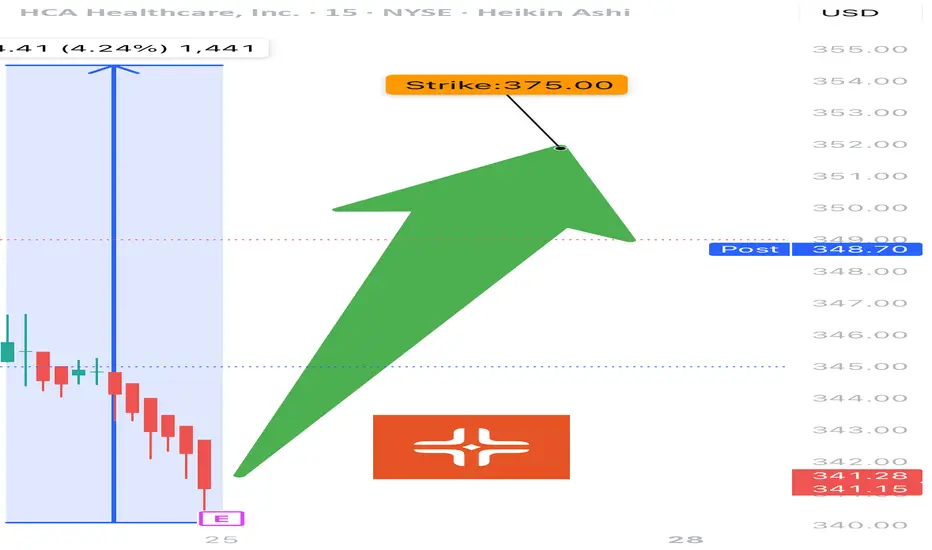
HCA EARNINGS TRADE (07/24)
🚨 HCA EARNINGS TRADE (07/24) 🚨
🏥 Healthcare with earnings tonight after close — high-upside setup brewing.
🧠 Quick Breakdown:
• 📊 Revenue Growth: +5.7% (stable, defensive sector)
• 💸 Margins: Operating 15.6%, EBITDA 19.9% = efficient and strong
• 🧠 Beat Rate: 75% with 6.7% avg surprise → credible
HCA exhibits strong financial health!Technical Analysis
HCA's stock has demonstrated resilience, with a 52-week range between $276.50 and $417.14. The Relative Strength Index (RSI) stands at 58.01, suggesting the stock is neither overbought nor oversold. The Moving Average Convergence Divergence (MACD) is 0.11, indicating a potential

HCA Advances as Tech StumblesHealthcare is the leading sector so far this year, and some traders may see opportunity in hospital operator HCA Healthcare.
Today’s weekly chart considers the all-time high above $410 in October, followed by a substantial pullback. Prices stabilized early this year around $290 (near the low from l

Head & ShouldersThis pattern consists of 2 shoulders that should be in the same ballpark in price but are rarely the exact same price.
The 2 shoulders should be close to the same distance from the head which is a high point between the 2 shoulders.
T1 has just about been met. Sometimes t1 is all we get.
Earnings

HCA - head & ShouldersThis is usually a market leader! When market leaders trigger bearish patterns, you need to be cautious.
Not an all out short but with bearish consolidation under the neckline it's worth taking a stab.
As long as rejection occurs at the neckline this could see like downside.

$HCA with a bullish outlook following its earnings #StocksThe PEAD projected a bullish outlook for NYSE:HCA after a negative over reaction following its earnings release placing the stock in drift C with an expected accuracy of 55.56%.

See all ideas
Summarizing what the indicators are suggesting.
Oscillators
Neutral
SellBuy
Strong sellStrong buy
Strong sellSellNeutralBuyStrong buy
Oscillators
Neutral
SellBuy
Strong sellStrong buy
Strong sellSellNeutralBuyStrong buy
Summary
Neutral
SellBuy
Strong sellStrong buy
Strong sellSellNeutralBuyStrong buy
Summary
Neutral
SellBuy
Strong sellStrong buy
Strong sellSellNeutralBuyStrong buy
Summary
Neutral
SellBuy
Strong sellStrong buy
Strong sellSellNeutralBuyStrong buy
Moving Averages
Neutral
SellBuy
Strong sellStrong buy
Strong sellSellNeutralBuyStrong buy
Moving Averages
Neutral
SellBuy
Strong sellStrong buy
Strong sellSellNeutralBuyStrong buy
Displays a symbol's price movements over previous years to identify recurring trends.
HCA.GF
Columbia/HCA Healthcare Corp. 7.5% 15-NOV-2095Yield to maturity
6.64%
Maturity date
Nov 15, 2095
HCA5372914
HCA Inc. 4.375% 15-MAR-2042Yield to maturity
6.21%
Maturity date
Mar 15, 2042
HCA5372916
HCA Inc. 4.625% 15-MAR-2052Yield to maturity
6.15%
Maturity date
Mar 15, 2052
HCA5757225
HCA Inc. 6.1% 01-APR-2064Yield to maturity
6.13%
Maturity date
Apr 1, 2064
HCA6009047
HCA Inc. 6.2% 01-MAR-2055Yield to maturity
6.07%
Maturity date
Mar 1, 2055
HCA5868805
HCA Inc. 5.95% 15-SEP-2054Yield to maturity
6.05%
Maturity date
Sep 15, 2054
HCA5581318
HCA Inc. 5.9% 01-JUN-2053Yield to maturity
6.04%
Maturity date
Jun 1, 2053
HCA5757224
HCA Inc. 6.0% 01-APR-2054Yield to maturity
6.03%
Maturity date
Apr 1, 2054
HCA4843309
HCA Inc. 5.25% 15-JUN-2049Yield to maturity
6.01%
Maturity date
Jun 15, 2049
HCA6217610
HCA Inc. 5.7% 15-NOV-2055Yield to maturity
6.00%
Maturity date
Nov 15, 2055
HCA5604246
HCA Inc. 4.625% 15-MAR-2052Yield to maturity
5.98%
Maturity date
Mar 15, 2052
See all H1CA34 bonds