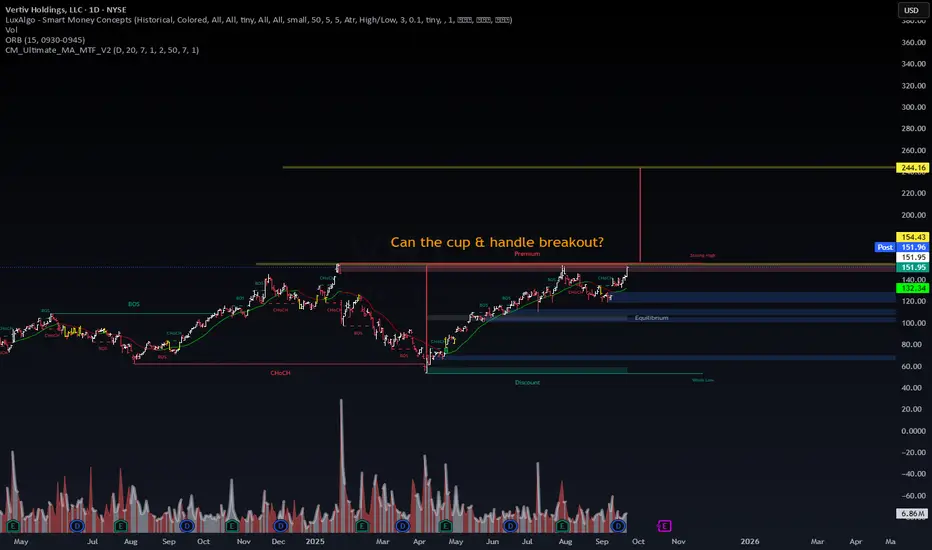
$VRT — Cup & Handle at Prior Highs: Is a Breakout Next?Thesis: Price is pressing the 154.4–155 strong-high. I’m tracking a daily close >154.5 and a retest-hold for confirmation. Measured move points to 165 → 178–180 → 200 if momentum + volume align (Bulkowski, 2012; Edwards et al., 2013).
Key Catalysts (near-term relevance):
AI data-center CAPEX tailw
Vertiv Holdings LLC Shs Unsponsored Brazilian Depositary Receipt Repr 0.1 Sh
No trades
Next report date
—
Report period
—
EPS estimate
—
Revenue estimate
—
14.466 BRL
3.07 B BRL
49.67 B BRL
375.18 M
About Vertiv Holdings, LLC
Sector
Industry
CEO
Giordano Albertazzi
Website
Headquarters
Westerville
Founded
1946
ISIN
BRV1RTBDR002
FIGI
BBG01TCJ1FS5
Vertiv Holdings Co. engages in the design, manufacture, and service of critical digital infrastructure technology for data centers, communication networks, and commercial and industrial environments. It also offers power management products, switchgear and busbar products, thermal management products, integrated rack systems, modular solutions, and management systems for monitoring and controlling digital infrastructure. It operates through the following geographical segments: Americas, Asia Pacific, and Europe, Middle East, and Africa (EMEA). The Americas segment offers products and services sold for applications within the data center, communication networks, and commercial and industrial markets in North America and Latin America. The Asia Pacific segment includes products and services sold for applications within the data center, communication networks, and commercial or industrial markets throughout Greater China, Australia and New Zealand, Southeast Asia, and India. The EMEA segment focuses on products and services sold for applications within the data center, communication networks, and commercial and industrial markets in Europe, Middle East, and Africa. The company was founded in 1946 and is headquartered in Columbus, OH.
Related stocks
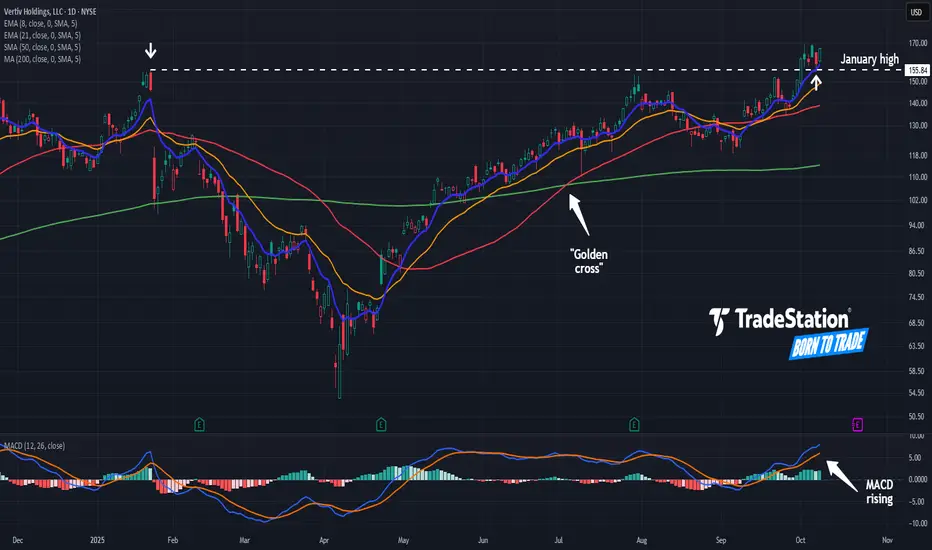
Vertiv May Have Broken OutVertiv was an early leader in the AI rally, and now it may be breaking out again.
The first pattern on today’s chart is the January high of $155.84. The provider of data-center power and cooling products began October by breaking above that level. This week, it pulled back to test it. Has old resis
Vertiv - Strong bullish trend ahead NYSE:VRT has seen a restoration of upside after breaking out of the flag and tested multiple times on the bearish gap zone between 125-146 range. Rounding v-shaped bottom will also propel the stock further into upsside. Momentum wise, the stock's upside momentum remain healthy ranging from short to

Inverse H&S forming on VRT? Am I hallucinating, or does that not look like the most clear-cut inverse H&S pattern?
Full disclosure, I have no idea whether this will breakout at all. I was just cruising through some data center-related stocks and spotted this interesting formation.
Leaving this here to look back on in a few

VRT – Demand Zone Defense & Trend Break📊 VRT – Demand Zone Defense & Trend Break
The past four sessions tested conviction. After a clean downtrend break, NYSE:VRT tapped into the $125–127 demand zone and attracted strong buyer aggression — exactly where liquidity confluence aligned with the 0.702 retracement.
🔹 Market Structure
Down

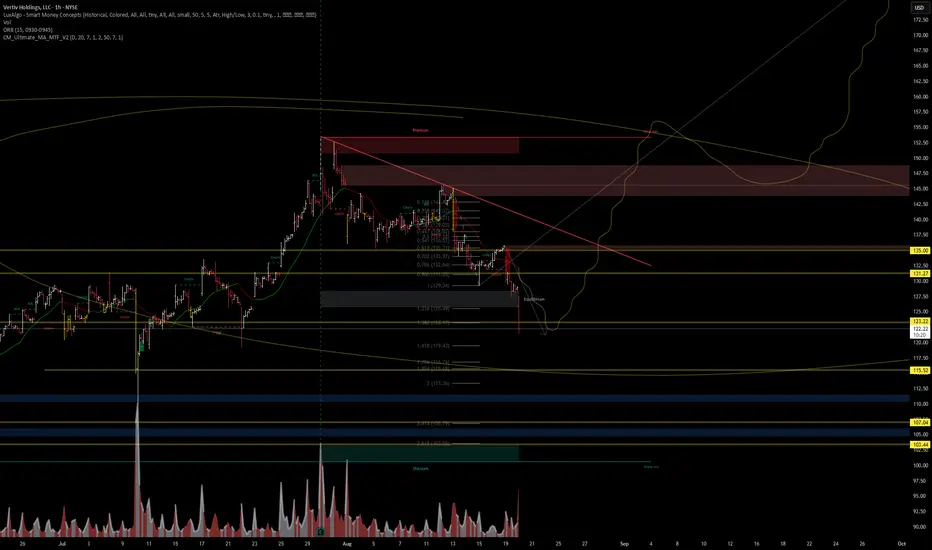
3rd Day in the trade, trusting AI to manage the risk🔎 Chart Structure & Key Zones
Trend Context: The chart shows a recent breakdown from an uptrend. Price rejected near ~$145–148 (supply zone), confirming resistance.
Current Price: ~$122, trading under key moving averages and inside a corrective structure.
Volume Profile: Distribution spikes near
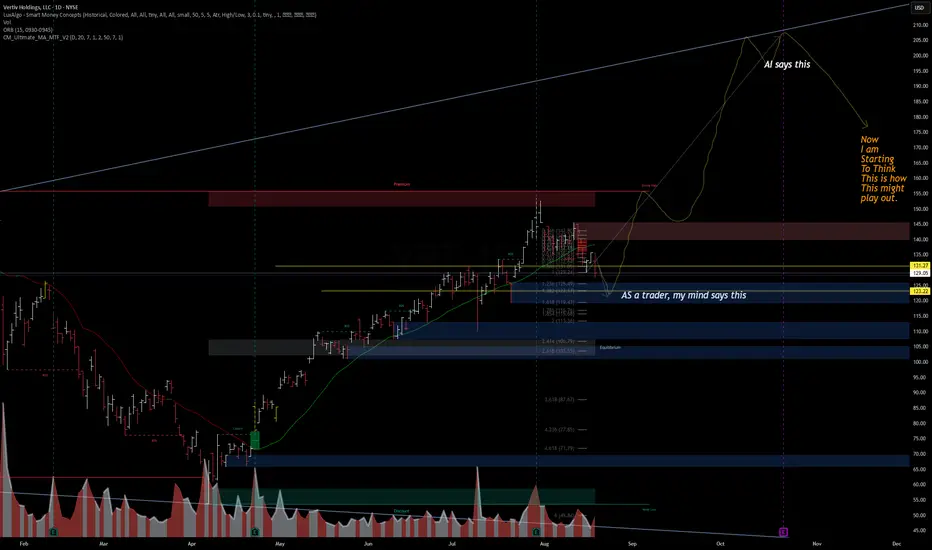
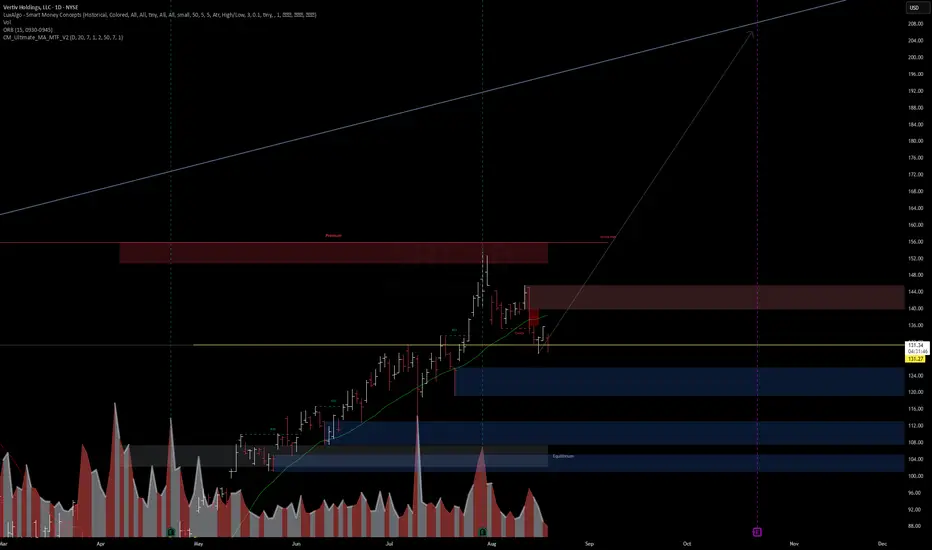
$VRT | Vertiv Holdings – AI vs Trader Mindset📊 NYSE:VRT | Vertiv Holdings – AI vs Trader Mindset
Interesting divergence here:
AI projection (yellow path) suggests a continuation higher toward $200+ before a macro pullback.
Trader’s view (blue zones) highlights liquidity gaps and possible retracement targets at $123, $116, and $106 before
2nd Day in the trade. VRTPositions down, had an unexpected sell-off from the market. Position taken for a month, until next ER, will observe the price, volume, and participants. AI models have not changed, see you at $150
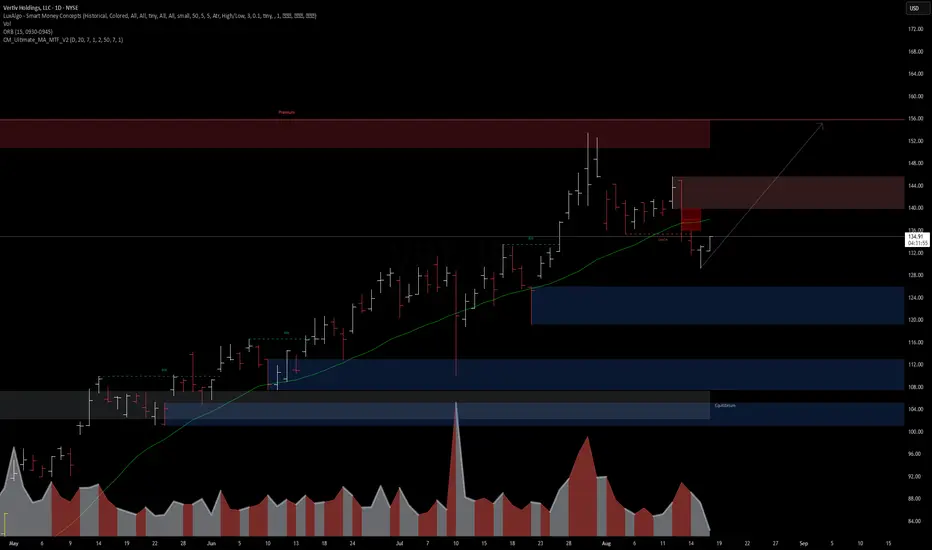
VRT (Vertiv Holdings) – Institutional Forecast & Smart Mone🔮 Forecast & DSS Outlook
Current Price: $134.77
Institutional Forecast Model: STRONG BUY
Target: $154.53 (+14.7% upside in 30 days)
Confidence Interval: $131.71 – $161.46
Expected Return: +14.66%
Risk/Reward: 1.74 : 1
Model Agreement: 7 of 9 bullish
📈 Our DSS (Decision Support System) signal
VRT : Long Position Vertiv Holdings is trading above the 50 and 200-period moving averages.
It has overcome the resistances one by one without being exposed to a very high IV.
It has started to draw a cup.
However, it is much better to focus on the big gap rather than the cup formation because with good chances it c

See all ideas
Summarizing what the indicators are suggesting.
Oscillators
Neutral
SellBuy
Strong sellStrong buy
Strong sellSellNeutralBuyStrong buy
Oscillators
Neutral
SellBuy
Strong sellStrong buy
Strong sellSellNeutralBuyStrong buy
Summary
Neutral
SellBuy
Strong sellStrong buy
Strong sellSellNeutralBuyStrong buy
Summary
Neutral
SellBuy
Strong sellStrong buy
Strong sellSellNeutralBuyStrong buy
Summary
Neutral
SellBuy
Strong sellStrong buy
Strong sellSellNeutralBuyStrong buy
Moving Averages
Neutral
SellBuy
Strong sellStrong buy
Strong sellSellNeutralBuyStrong buy
Moving Averages
Neutral
SellBuy
Strong sellStrong buy
Strong sellSellNeutralBuyStrong buy