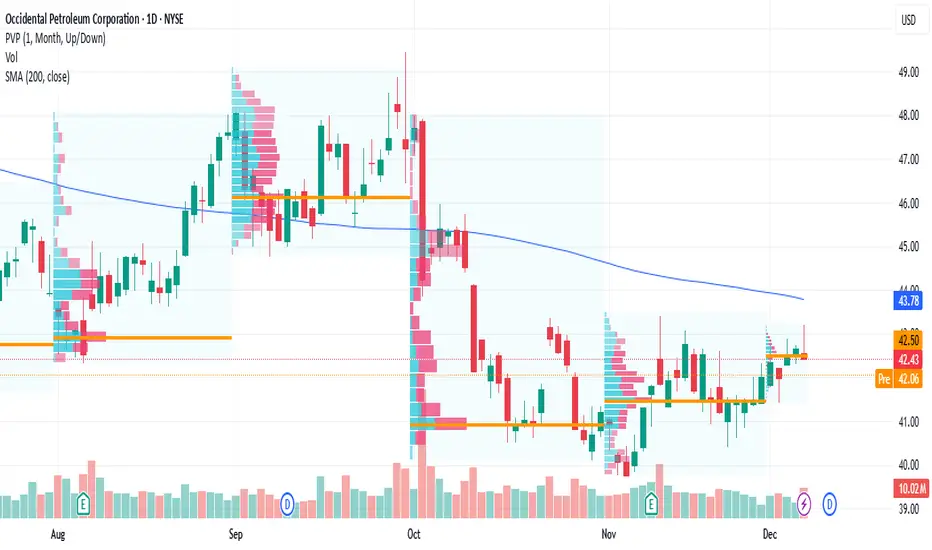
Occidental Petroleum's bearish setup points to near-term weaknes
Current Price: $42.43
Direction: SHORT
Confidence Level: 62% (Based on trader consensus leaning bearish, mixed but cautious X sentiment, and recent inability to break key resistance)
Targets:
- T1 = $41.60
- T2 = $40.80
Stop Levels:
- S1 = $43.40
- S2 = $44.20
**Wisdom of Professional Traders
Occidental Petroleum Corporation
No trades
Next report date
—
Report period
—
EPS estimate
—
Revenue estimate
—
26.14 MXN
63.44 B MXN
565.00 B MXN
981.74 M
About Occidental Petroleum Corporation
Sector
Industry
CEO
Vicki A. Hollub
Website
Headquarters
Houston
Founded
1920
Identifiers
3
ISINUS6745991058
Occidental Petroleum Corp. engages in the exploration and production of oil and natural gas. It operates through the following segments: Oil and Gas, Chemical, and Midstream and Marketing. The Oil and Gas segment explores for, develops and produces oil and condensate, natural gas liquids, and natural gas. The Chemical segment manufactures and markets basic chemicals and vinyls. The Midstream and Marketing segment purchases, markets, gathers, processes, transports and stores oil, condensate, natural gas liquids, natural gas, carbon dioxide, and power. The company was founded in 1920 and is headquartered in Houston, TX.
Related stocks
Short LYFTI don't like momentum and time for this rideshare company pick at this time.
Shooting for Nov 25th expiration , $21.50 strike priced at 45c
Happy Trading !
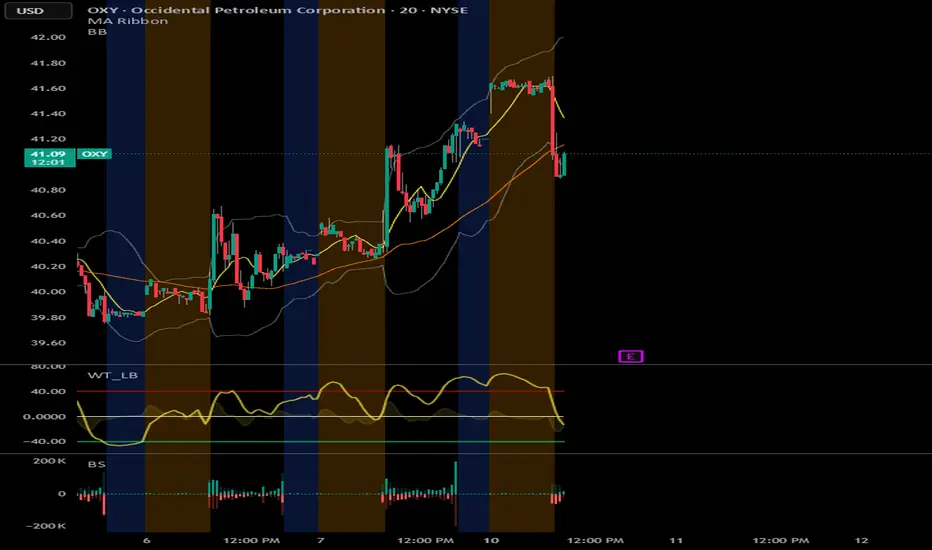
Long OXYI like the momentum and time for this petroleum pick at this time.
Shooting for Nov 25th expiration , $42 strike priced at 75c
Happy Trading !

OXY - Strong potential for bullish mean-reversionNYSE:OXY is looking at a potential break to the upside and likely to see strong bullish upside as bullish marobozu is testing the bearish gap resistance zone. Furthermore, the stock has also broken out of the downtrend line. Long-term MACD is back in action as both MACD/signal line is rising steadi

OXY long term Elliott wave projection with Gartley patternPlease follow the black line scenario for buying opportunities.
Notice the heavy volume near the bottom.

Occidental Petroleum (OXY): A Powerhouse in Energy with Major UpOccidental Petroleum (OXY) is one of the largest oil and gas producers in the U.S., with a highly integrated operations model spanning upstream, midstream, and chemical segments. ✅
🏆 Key Highlights:
Strategic CrownRock acquisition significantly enhances scale and proved reserves.
Strong c

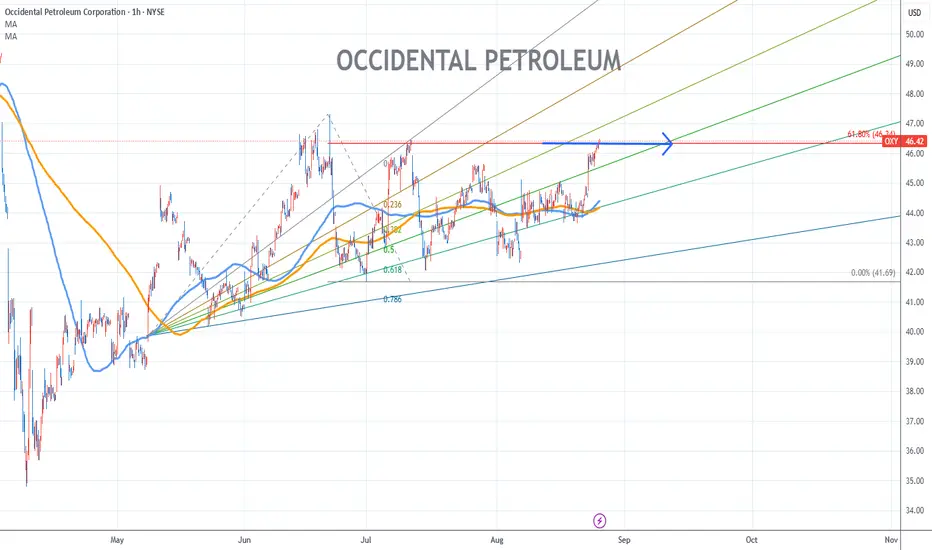
Occidental Petroleum Stock Chart Fibonacci Analysis 082525Trading Idea
1) Find a FIBO slingshot
2) Check FIBO 61.80% level
3) Entry Point > 46/61.80%
Chart time frame:B
A) 15 min(1W-3M)
B) 1 hr(3M-6M)
C) 4 hr(6M-1year)
D) 1 day(1-3years)
Stock progress:A
A) Keep rising over 61.80% resistance
B) 61.80% resistance
C) 61.80% support
D) Hit the bottom
E)
OXYSymmetrical Triangle i go for Long when price beark mention levels.
Buy Stop
EP: 47.47
Stop Loss 41.73
Take profit 53.19
RRR 1:1
(12% Trade plan)

OXY Bullish BreakoutOXY poised to breakout to $49 in the near term.
Bellwether XOM has already made a move above it's 200 day SMA, I expect OXY and other energy laggards to follow suit.
53.75 medium term target.
Good luck! This is not financial advice.

$OXY – Positioning for a Bullish Breakout ?📊 Technical Overview
NYSE:OXY has been in a prolonged downtrend, but recent price action is showing a potential structural reversal:
LL to HL / HH shift suggests the downtrend may be bottoming out.
Currently forming a Higher Low (HL) after printing two Higher Highs (HH) – a classic bullish marke

See all ideas
Summarizing what the indicators are suggesting.
Neutral
SellBuy
Strong sellStrong buy
Strong sellSellNeutralBuyStrong buy
Neutral
SellBuy
Strong sellStrong buy
Strong sellSellNeutralBuyStrong buy
Neutral
SellBuy
Strong sellStrong buy
Strong sellSellNeutralBuyStrong buy
An aggregate view of professional's ratings.
Neutral
SellBuy
Strong sellStrong buy
Strong sellSellNeutralBuyStrong buy
Neutral
SellBuy
Strong sellStrong buy
Strong sellSellNeutralBuyStrong buy
Neutral
SellBuy
Strong sellStrong buy
Strong sellSellNeutralBuyStrong buy
Displays a symbol's price movements over previous years to identify recurring trends.
A
APC3666452
Anadarko Petroleum Corporation 7.73% 15-SEP-2096Yield to maturity
7.13%
Maturity date
Sep 15, 2096
A
APC3666453
Anadarko Petroleum Corporation 7.25% 15-NOV-2096Yield to maturity
7.03%
Maturity date
Nov 15, 2096
APC4876396
Occidental Petroleum Corporation 7.5% 01-NOV-2096Yield to maturity
6.82%
Maturity date
Nov 1, 2096
U
APC.GT
Union Pacific Resources Group, Inc. 7.5% 01-NOV-2096Yield to maturity
6.80%
Maturity date
Nov 1, 2096
A
APC4141602
Anadarko Petroleum Corporation 4.5% 15-JUL-2044Yield to maturity
6.77%
Maturity date
Jul 15, 2044
APC4875631
Occidental Petroleum Corporation 7.73% 15-SEP-2096Yield to maturity
6.66%
Maturity date
Sep 15, 2096
OPCE
Occidental Petroleum Corporation 4.1% 15-FEB-2047Yield to maturity
6.65%
Maturity date
Feb 15, 2047
OPCC
Occidental Petroleum Corporation 4.625% 15-JUN-2045Yield to maturity
6.61%
Maturity date
Jun 15, 2045
A
APC3675627
Anadarko Petroleum Corporation 7.95% 15-JUN-2039Yield to maturity
6.52%
Maturity date
Jun 15, 2039
APC4869088
Occidental Petroleum Corporation 4.4% 15-AUG-2049Yield to maturity
6.50%
Maturity date
Aug 15, 2049
APC4875630
Occidental Petroleum Corporation 4.5% 15-JUL-2044Yield to maturity
6.49%
Maturity date
Jul 15, 2044
See all OXY1 bonds
Curated watchlists where OXY1 is featured.

Female-led stocks: Who rules the world?
34 No. of Symbols

Upstream oil: Liquid gold extractors
34 No. of Symbols
See all sparks
Frequently Asked Questions
The current price of OXY1 is 715.03 MXN — it has increased by 0.42% in the past 24 hours. Watch Occidental Petroleum Corporation stock price performance more closely on the chart.
Depending on the exchange, the stock ticker may vary. For instance, on BMV exchange Occidental Petroleum Corporation stocks are traded under the ticker OXY1.
OXY1 stock has fallen by −4.66% compared to the previous week, the month change is a −7.38% fall, over the last year Occidental Petroleum Corporation has showed a −24.50% decrease.
We've gathered analysts' opinions on Occidental Petroleum Corporation future price: according to them, OXY1 price has a max estimate of 1,206.99 MXN and a min estimate of 684.56 MXN. Watch OXY1 chart and read a more detailed Occidental Petroleum Corporation stock forecast: see what analysts think of Occidental Petroleum Corporation and suggest that you do with its stocks.
OXY1 reached its all-time high on Aug 29, 2022 with the price of 1,535.00 MXN, and its all-time low was 186.00 MXN and was reached on Oct 28, 2020. View more price dynamics on OXY1 chart.
See other stocks reaching their highest and lowest prices.
See other stocks reaching their highest and lowest prices.
OXY1 stock is 0.97% volatile and has beta coefficient of 0.55. Track Occidental Petroleum Corporation stock price on the chart and check out the list of the most volatile stocks — is Occidental Petroleum Corporation there?
Today Occidental Petroleum Corporation has the market capitalization of 703.19 B, it has decreased by −7.78% over the last week.
Yes, you can track Occidental Petroleum Corporation financials in yearly and quarterly reports right on TradingView.
Occidental Petroleum Corporation is going to release the next earnings report on Feb 25, 2026. Keep track of upcoming events with our Earnings Calendar.
OXY1 earnings for the last quarter are 11.73 MXN per share, whereas the estimation was 9.39 MXN resulting in a 24.99% surprise. The estimated earnings for the next quarter are 6.18 MXN per share. See more details about Occidental Petroleum Corporation earnings.
Occidental Petroleum Corporation revenue for the last quarter amounts to 121.43 B MXN, despite the estimated figure of 123.79 B MXN. In the next quarter, revenue is expected to reach 113.11 B MXN.
OXY1 net income for the last quarter is 15.14 B MXN, while the quarter before that showed 8.08 B MXN of net income which accounts for 87.29% change. Track more Occidental Petroleum Corporation financial stats to get the full picture.
Yes, OXY1 dividends are paid quarterly. The last dividend per share was 4.36 MXN. As of today, Dividend Yield (TTM)% is 2.37%. Tracking Occidental Petroleum Corporation dividends might help you take more informed decisions.
Occidental Petroleum Corporation dividend yield was 1.78% in 2024, and payout ratio reached 36.00%. The year before the numbers were 1.21% and 18.44% correspondingly. See high-dividend stocks and find more opportunities for your portfolio.
As of Dec 21, 2025, the company has 13.32 K employees. See our rating of the largest employees — is Occidental Petroleum Corporation on this list?
EBITDA measures a company's operating performance, its growth signifies an improvement in the efficiency of a company. Occidental Petroleum Corporation EBITDA is 236.92 B MXN, and current EBITDA margin is 49.61%. See more stats in Occidental Petroleum Corporation financial statements.
Like other stocks, OXY1 shares are traded on stock exchanges, e.g. Nasdaq, Nyse, Euronext, and the easiest way to buy them is through an online stock broker. To do this, you need to open an account and follow a broker's procedures, then start trading. You can trade Occidental Petroleum Corporation stock right from TradingView charts — choose your broker and connect to your account.
Investing in stocks requires a comprehensive research: you should carefully study all the available data, e.g. company's financials, related news, and its technical analysis. So Occidental Petroleum Corporation technincal analysis shows the sell today, and its 1 week rating is sell. Since market conditions are prone to changes, it's worth looking a bit further into the future — according to the 1 month rating Occidental Petroleum Corporation stock shows the strong sell signal. See more of Occidental Petroleum Corporation technicals for a more comprehensive analysis.
If you're still not sure, try looking for inspiration in our curated watchlists.
If you're still not sure, try looking for inspiration in our curated watchlists.