Amazing breakout on WEEKLY Timeframe - WOCKPHARMACheckout an amazing breakout happened in the stock in Weekly timeframe, macroscopically seen in Daily timeframe. Having a great favor that the stock might be bullish expecting a staggering returns of minimum 25% TGT. IMPORTANT BREAKOUT LEVELS ARE ALWAYS RESPECTED!
NOTE for learners: Place the break
−7.60 INR
−470.00 M INR
29.15 B INR
80.46 M
About WOCKHARDT LTD
Sector
Industry
CEO
Murtaza Habil Khorakiwala
Website
Headquarters
Mumbai
Founded
1967
ISIN
INE049B01025
FIGI
BBG000C6Z0G6
Wockhardt Ltd. engages in the pharmaceutical business. Its products include formulations, biopharmaceuticals, nutrition products, vaccines and active pharmaceutical ingredients. The company was founded by Habil Fakhruddin Khorakiwala in 1967 and is headquartered in Mumbai, India.
No news here
Looks like there's nothing to report right now

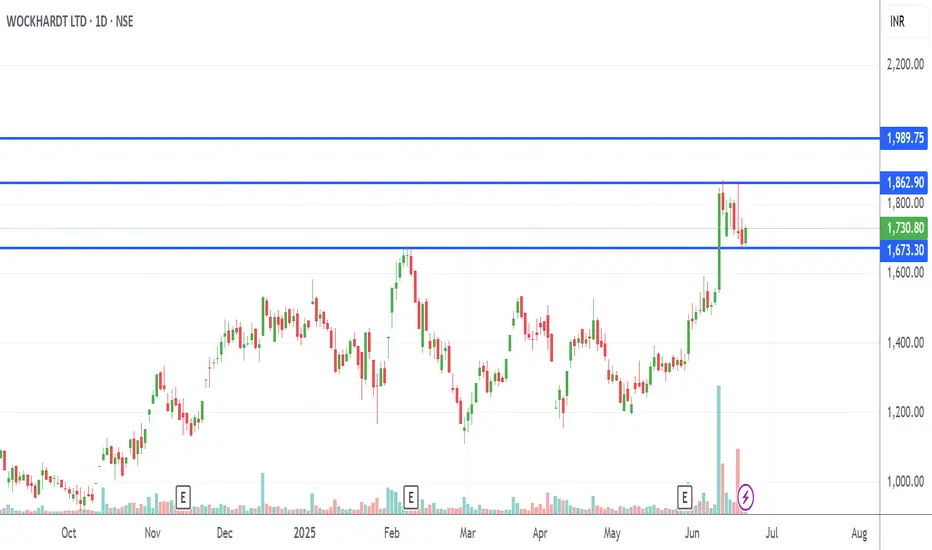
Good to Enter📊 Chart Overview
Current Price: ₹1,730.80
Day's Range: ₹1,670.50 – ₹1,739.90
Recent Trend: Strong uptrend from around ₹1,200 to above ₹1,800, followed by a short-term pullback.
🔍 Key Levels (marked on chart)
Support 1: ₹1,673.30
Current Zone: Around ₹1,730 – price currently testing this zone
Re


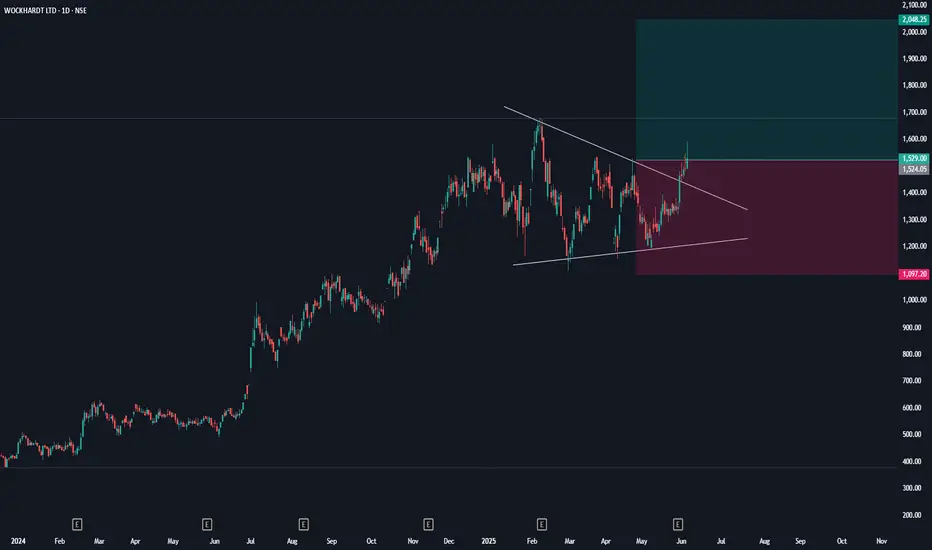
wockhardt pharma - bullish BOThe chart indicates a bullish setup with the price near the upper trendline. A breakout above 1,529 would confirm a bullish continuation, while a breakdown below 1,097 could signal a bearish reversal. Traders should monitor volume and use appropriate risk management strategies.
1. Understanding the

WOCKHARDT LTD S/RSupport and Resistance Levels:
Support Levels: These are price points (green line/shade) where a downward trend may be halted due to a concentration of buying interest. Imagine them as a safety net where buyers step in, preventing further decline.
Resistance Levels: Conversely, resistance levels (re


#WOCKPHARMA#WOCKPHARMA:
1) Up trend paused and created a base, Price approaching break out region.
2) High Relative strength Vs #CNX500
3) From leading sector - Pharma
4) Consolidating near break out region.
5) Decent Fundamentals
6) promotor / FII holding increased slightly
7) Good candidate for swing tra

See all ideas
Summarizing what the indicators are suggesting.
Oscillators
Neutral
SellBuy
Strong sellStrong buy
Strong sellSellNeutralBuyStrong buy
Oscillators
Neutral
SellBuy
Strong sellStrong buy
Strong sellSellNeutralBuyStrong buy
Summary
Neutral
SellBuy
Strong sellStrong buy
Strong sellSellNeutralBuyStrong buy
Summary
Neutral
SellBuy
Strong sellStrong buy
Strong sellSellNeutralBuyStrong buy
Summary
Neutral
SellBuy
Strong sellStrong buy
Strong sellSellNeutralBuyStrong buy
Moving Averages
Neutral
SellBuy
Strong sellStrong buy
Strong sellSellNeutralBuyStrong buy
Moving Averages
Neutral
SellBuy
Strong sellStrong buy
Strong sellSellNeutralBuyStrong buy
Displays a symbol's price movements over previous years to identify recurring trends.
Frequently Asked Questions
The current price of WOCKPHARMA is 1,461.90 INR — it has decreased by −1.14% in the past 24 hours. Watch WOCKHARDT LTD. stock price performance more closely on the chart.
Depending on the exchange, the stock ticker may vary. For instance, on BSE exchange WOCKHARDT LTD. stocks are traded under the ticker WOCKPHARMA.
WOCKPHARMA stock has fallen by −9.58% compared to the previous week, the month change is a −14.87% fall, over the last year WOCKHARDT LTD. has showed a 58.90% increase.
WOCKPHARMA reached its all-time high on Mar 12, 2013 with the price of 1,996.05 INR, and its all-time low was 62.20 INR and was reached on Mar 13, 2009. View more price dynamics on WOCKPHARMA chart.
See other stocks reaching their highest and lowest prices.
See other stocks reaching their highest and lowest prices.
WOCKPHARMA stock is 4.45% volatile and has beta coefficient of 1.36. Track WOCKHARDT LTD. stock price on the chart and check out the list of the most volatile stocks — is WOCKHARDT LTD. there?
Today WOCKHARDT LTD. has the market capitalization of 239.25 B, it has decreased by −5.67% over the last week.
Yes, you can track WOCKHARDT LTD. financials in yearly and quarterly reports right on TradingView.
WOCKPHARMA net income for the last quarter is −900.00 M INR, while the quarter before that showed −250.00 M INR of net income which accounts for −260.00% change. Track more WOCKHARDT LTD. financial stats to get the full picture.
No, WOCKPHARMA doesn't pay any dividends to its shareholders. But don't worry, we've prepared a list of high-dividend stocks for you.
As of Aug 11, 2025, the company has 3.41 K employees. See our rating of the largest employees — is WOCKHARDT LTD. on this list?
EBITDA measures a company's operating performance, its growth signifies an improvement in the efficiency of a company. WOCKHARDT LTD. EBITDA is 4.06 B INR, and current EBITDA margin is 10.29%. See more stats in WOCKHARDT LTD. financial statements.
Like other stocks, WOCKPHARMA shares are traded on stock exchanges, e.g. Nasdaq, Nyse, Euronext, and the easiest way to buy them is through an online stock broker. To do this, you need to open an account and follow a broker's procedures, then start trading. You can trade WOCKHARDT LTD. stock right from TradingView charts — choose your broker and connect to your account.
Investing in stocks requires a comprehensive research: you should carefully study all the available data, e.g. company's financials, related news, and its technical analysis. So WOCKHARDT LTD. technincal analysis shows the sell today, and its 1 week rating is sell. Since market conditions are prone to changes, it's worth looking a bit further into the future — according to the 1 month rating WOCKHARDT LTD. stock shows the buy signal. See more of WOCKHARDT LTD. technicals for a more comprehensive analysis.
If you're still not sure, try looking for inspiration in our curated watchlists.
If you're still not sure, try looking for inspiration in our curated watchlists.