#BSW/USDT : Another Attempt To Resume Upward Movement#BSW
The price is moving within an ascending channel on the 1-hour timeframe and is adhering to it well. It is poised to break out strongly and retest the channel.
We have a downtrend line on the RSI indicator that is about to break and retest, which supports the upward move.
There is a key support zone in green at 0.004660, representing a strong support point.
We have a trend of consolidation above the 100-period moving average.
Entry price: 0.005160
First target: 0.004880
Second target: 0.005000
Third target: 0.005159
Don't forget a simple money management rule.
Place your stop-loss order below the green support zone.
Once you reach the first target, save some money and then change your stop-loss order to an entry order.
For any questions, please leave a comment.
Thank you.
Market insights

#BSW/USDT : Another Attempt To Resume Upward Movement#BSW
The price is moving in a descending channel on the 1-hour frame and is expected to break it and continue upward.
We have a trend to stabilize above the 100 moving average again.
We have a downtrend on the RSI indicator that supports the upward break.
We have a major support area in green that pushed the price higher at 0.005300.
Entry price: 0.005485.
First target: 0.005633.
Second target: 0.005800.
Third target: 0.006030.
To manage risk, don't forget stop loss and capital management.
The stop loss is below the support area in green.
When the first target is reached, save some profits and then change the stop order to an entry order.
For inquiries, please comment.
Thank you.

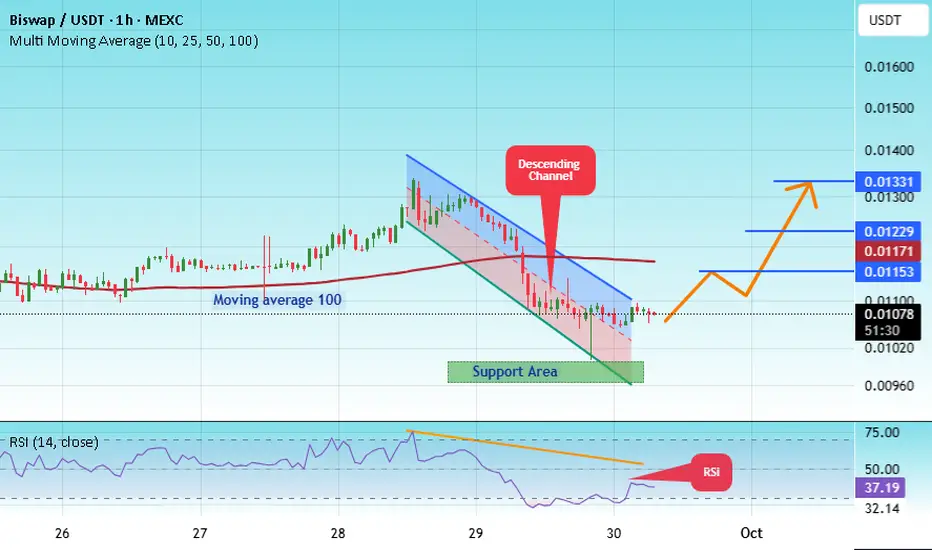
#BSW/USDT How Long Will It Take For A $ 0.01331Target?#BSW
The price is moving within a descending channel on the 1-hour frame, adhering well to it, and is heading for a strong breakout and retest.
We have a bearish trend on the RSI indicator that is about to be broken and retested, which supports the upward breakout.
There is a major support area in green at 0.00981, representing a strong support point.
We are heading for consolidation above the 100 moving average.
Entry price: 0.01075
First target: 0.01153
Second target: 0.01229
Third target: 0.01331
Don't forget a simple matter: capital management.
When you reach the first target, save some money and then change your stop-loss order to an entry order.
For inquiries, please leave a comment.
Thank you.
#BSW/USDT is bullish engulfing and also took ?#BSW
The price is moving within a descending channel on the 1-hour frame, adhering well to it, and is heading for a strong breakout and retest.
We have a bearish trend on the RSI indicator that is about to be broken and retested, which supports the upward breakout.
There is a major support area in green at 0.0108, representing a strong support point.
We are heading for consolidation above the 100 moving average.
Entry price: 0.0122
First target: 0.0142
Second target: 0.0163
Third target: 0.0187
Don't forget a simple matter: capital management.
When you reach the first target, save some money and then change your stop-loss order to an entry order.
For inquiries, please leave a comment.
Thank you.

#BSW/USDT is bullish engulfing and also took ?#BSW
The price is moving within a descending channel on the 1-hour frame, adhering well to it, and is heading for a strong breakout and retest.
We have a bearish trend on the RSI indicator that is about to be broken and retested, which supports the upward breakout.
There is a major support area in green at 0.02600, which represents a strong support point.
For inquiries, please leave a comment.
We are in a consolidation trend above the 100 Moving Average.
Entry price: 0.02717
First target: 0.02990
Second target: 0.03280
Third target: 0.03622
Don't forget a simple matter: capital management.
When you reach the first target, save some money and then change your stop-loss order to an entry order.
For inquiries, please leave a comment.
Thank you.

#BSW/USDT is bullish engulfing and also took ?#BSW
The price is moving within a descending channel on the 1-hour frame and is expected to break and continue upward.
We have a trend to stabilize above the 100 moving average once again.
We have a downtrend on the RSI indicator that supports the upward break.
We have a support area at the lower boundary of the channel at 0.02040, acting as strong support from which the price can rebound.
We have a major support area in green that pushed the price upward at 0.01975.
Entry price: 0.02325
First target: 0.02450
Second target: 0.02641
Third target: 0.02873
To manage risk, don't forget stop loss and capital management.
When you reach the first target, save some profits and then change the stop order to an entry order.
For inquiries, please comment.
Thank you.

#BSW/USDT How Long Will It Take For A $0.01754 Target?#BSW
The price is moving within a descending channel on the 1-hour frame, adhering well to it, and is heading for a strong breakout and retest.
We have a bearish trend on the RSI indicator that is about to be broken and retested, which supports the upward breakout.
There is a major support area in green at 0.01660, which represents a strong support point.
For inquiries, please leave a comment.
We are in a consolidation trend above the 100 Moving Average.
Entry price: 0.01716
First target: 0.01731
Second target: 0.01760
Third target: 0.01792
Don't forget a simple matter: capital management.
When you reach the first target, save some money and then change your stop-loss order to an entry order.
For inquiries, please leave a comment.
Thank you.

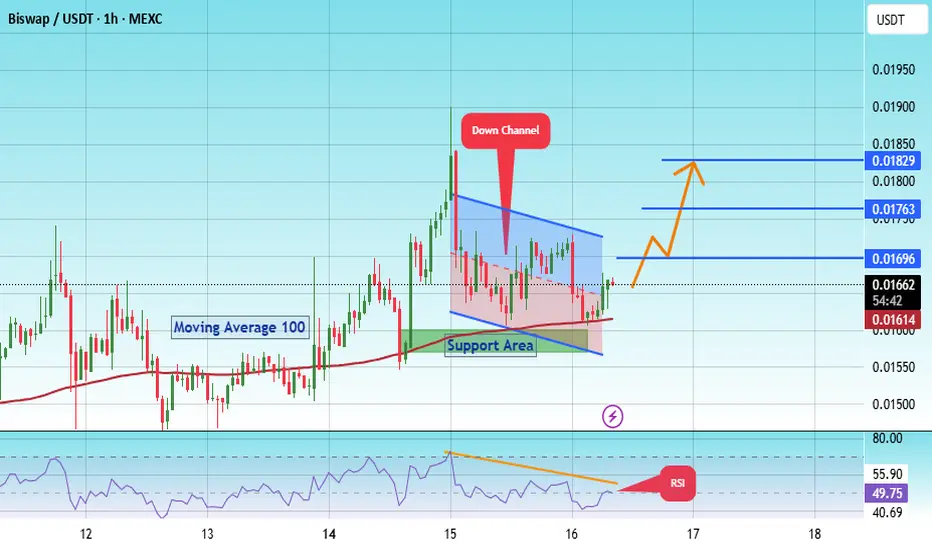
#BSW/USDT is bullish engulfing and also took ?#BSW
The price is moving within a descending channel on the 1-hour frame, adhering well to it, and is on its way to breaking it strongly upwards and retesting it.
We have a bounce from the lower boundary of the descending channel. This support is at 0.01580.
We have a downtrend on the RSI indicator that is about to break and retest, supporting the upward move.
There is a key support area in green at 0.01573, which represents a strong basis for the upward move.
Don't forget one simple thing: ease and capital.
When you reach the first target, save some money and then change your stop-loss order to an entry order.
For inquiries, please leave a comment.
We have a trend of stability above the Moving Average 100.
Entry price: 0.01650
First target: 0.01696
Second target: 0.01763
Third target: 0.01829
Don't forget one simple thing: ease and capital.
When you reach the first target, save some money and then change your stop-loss order to an entry order.
For inquiries, please leave a comment.
Thank you.
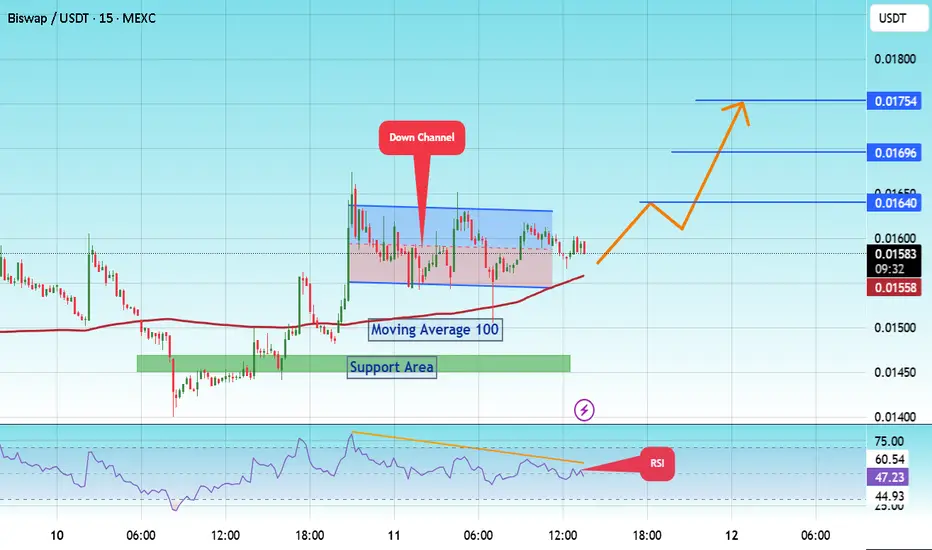
#BSW/USDT How Long Will It Take For A $0.01754 Target?#BSW
The price is moving within a descending channel on the 15-minute frame and is expected to break and continue upward.
We have a trend to stabilize above the 100 Moving Average once again.
We have a downtrend on the RSI indicator that supports the upward break.
We have a support area at the lower boundary of the channel at 0.01546, acting as strong support from which the price can rebound.
We have a major support area in green that pushed the price upward at 0.01450.
Entry price: 0.01595
First target: 0.01640
Second target: 0.1696
Third target: 0.01754
To manage risk, don't forget stop loss and capital management.
When you reach the first target, save some profits and then change the stop order to an entry order.
For inquiries, please comment.
Thank you.
#BSW/USDT is bullish engulfing and also took#BSW
The price is moving within a descending channel on the 1-hour frame and is expected to break and continue upward.
We have a trend to stabilize above the 100 moving average once again.
We have a downtrend on the RSI indicator that supports the upward break.
We have a support area at the lower boundary of the channel at 0.01060, acting as strong support from which the price can rebound.
We have a major support area in green that pushed the price upward at 0.01020.
Entry price: 0.01300
First target: 0.01545
Second target: 0.01817
Third target: 0.02083
To manage risk, don't forget stop loss and capital management.
When you reach the first target, save some profits and then change the stop order to an entry order.
For inquiries, please comment.
Thank you.

BSW Bull Trap:Binance Delisting + Weak Fundamentals = -50% AheadToday, I want to analyze the Biswap project ( BINANCE:BSWUSDT ) with the BSW token for you and examine the opportunity for a short position on the BSW token from a Fundamental and Technical perspective.
First, let's examine the conditions of the Biswap project from a Fundamental perspective.
Biswap is a decentralized exchange (DEX) built on the BNB Chain, offering features like token swaps, farming, staking, and an NFT marketplace. It became popular due to its very low trading fees (0.1%) and an aggressive referral & reward system.
However, the project is facing key fundamental issues:
Decline in trading volume and user activity
Drop in TVL rankings among DEX platforms
Inflationary tokenomics with constant reward emissions, increasing sell pressure
Most critically, Binance announced the delisting of BSW (effective July 4, 2025), shaking investor confidence severely .
In summary, while Biswap started strong, its fundamentals have weakened significantly, especially after the Binance delisting, which casts doubt over its future viability.
---------------------------------------------------
In terms of Technical Analysis , the BSW token managed to reach the Heavy Resistance zone($0.060-$0.0315) and Potential Reversal Zone(PRZ) with the previous hours' pump( more than +100% ), but then started to decline again.
In terms of Elliott wave theory , I consider the recent hours pump as a wave C of the Zigzag Correction(ABC/5-3-5) .
I expect that given the delisting(soon) of the BSW token and the technical analysis of the BSW token, it will fall by at least -50% . In fact, this pump could act as a Bull Trap .
Note: Stop Loss(SL)= $0.0422 = We can expect more pumps.
Please respect each other's ideas and express them politely if you agree or disagree.
Biswap Analyze (BSWUSDT), 1-hour time frame.
Be sure to follow the updated ideas.
Do not forget to put a Stop loss for your positions (For every position you want to open).
Please follow your strategy and updates; this is just my Idea, and I will gladly see your ideas in this post.
Please do not forget the ✅' like '✅ button 🙏😊 & Share it with your friends; thanks, and Trade safe.


BSWUSDT Forming Falling WedgeBSWUSDT is currently showcasing a classic falling wedge pattern, a bullish reversal signal often associated with a sharp move to the upside once the pattern resolves. This technical structure forms when price action consolidates with lower highs and lower lows, while volume typically decreases — setting the stage for a breakout. In BSWUSDT’s case, the falling wedge has matured, and bullish interest is beginning to surface with improving volume levels, suggesting that accumulation is underway.
The technical breakout from this pattern could unlock strong upside potential, and current projections indicate a possible 90% to 100% gain in the coming sessions. This aligns well with historical performance of similar wedge formations in the crypto market, where the price often surges after breaking the upper resistance trendline. Traders are closely monitoring key resistance zones for confirmation and volume spikes that can validate the trend shift.
Investor sentiment toward the (BSW) ecosystem is growing steadily due to its utility in DeFi services and low trading fees. The increase in volume also indicates that smart money could be positioning ahead of a major move. Coupled with market-wide bullishness, BSWUSDT may soon experience a strong rally, driven by both technical and fundamental catalysts.
This setup offers a high-reward opportunity for swing traders and technical analysts who are focused on breakout trades and pattern-based strategies. The falling wedge combined with rising investor engagement makes BSWUSDT a potential breakout star to watch closely.
✅ Show your support by hitting the like button and
✅ Leaving a comment below! (What is You opinion about this Coin)
Your feedback and engagement keep me inspired to share more insightful market analysis with you!

BSWUSDT is printed bullish engulfing and also took BSWUSDT is printed bullish engulfing and also took support on looking good volume
BSW/USDT Analysis – Weekly Timeframe
#BSW The price is currently moving within a descending trend channel, showing attempts to break out of the structure.
📌 The ideal buy signal will be confirmed by a weekly candle close above the 0.0535 USDT level, which acts as a key resistance.
🎯 Potential upside targets after breakout:
Target 1: 0.1330 USDT
Target 2: 0.1648 USDT
Target 3: 0.2043 USDT
🛡 Key support zone: The lower boundary of the descending channel.

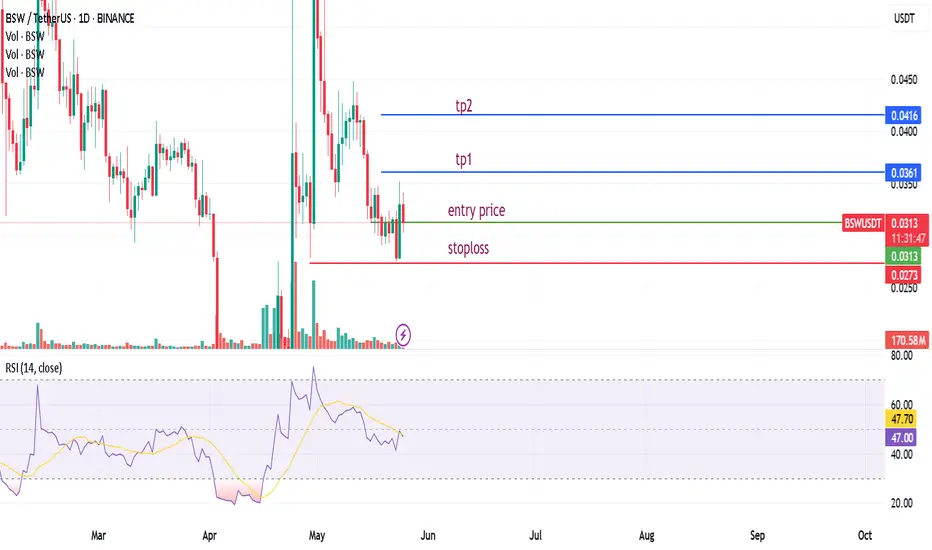
6/3 RR tradePrice may stop at the indicated daily SOR. Likely. A safer entry is provided however. There is good risk:reward for either trade!

BSW LONG Long
#BSW/USDT
Entry zone : 0.0416227 - 0.0428670
Targets : 0.0431224 - 0.0439763 - 0.0448302 - 0.0456841 - 0.0465380 - 0.0473919 - 0.0482458 - 0.0490997
Stop loss :0.0399063

BSW/USDTKey Level Zone: 0.06860 - 0.06890
Stoploss Level: 0.06850
HMT v4.1 detected. The setup looks promising, supported by a previous upward/downward trend with increasing volume and momentum, presenting an excellent reward-to-risk opportunity.
HMT (High Momentum Trending):
HMT is based on trend, momentum, volume, and market structure across multiple timeframes. It highlights setups with strong potential for upward movement and higher rewards.
Whenever I spot a signal for my own trading, I’ll share it. Please note that conducting a comprehensive analysis on a single timeframe chart can be quite challenging and sometimes confusing. I appreciate your understanding of the effort involved.
Important Note :
Role of Key Levels:
- These zones are critical for analyzing price trends. If the key level zone holds, the price may continue trending in the expected direction. However, momentum may increase or decrease based on subsequent patterns.
- Breakouts: If the key level zone breaks, it signals a stop-out. For reversal traders, this presents an opportunity to consider switching direction, as the price often retests these zones, which may act as strong support-turned-resistance (or vice versa).
My Trading Rules
Risk Management
- Maximum risk per trade: 2.5%.
- Leverage: 5x.
Exit Strategy
Profit-Taking:
- Sell at least 70% on the 3rd wave up (LTF Wave 5).
- Typically, sell 50% during a high-volume spike.
- Adjust stop-loss to breakeven once the trade achieves a 1.5:1 reward-to-risk ratio.
- If the market shows signs of losing momentum or divergence, ill will exit at breakeven.
The market is highly dynamic and constantly changing. HMT signals and target profit (TP) levels are based on the current price and movement, but market conditions can shift instantly, so it is crucial to remain adaptable and follow the market's movement.
If you find this signal/analysis meaningful, kindly like and share it.
Thank you for your support~
Sharing this with love!
HMT v2.0:
- Major update to the Momentum indicator
- Reduced false signals from inaccurate momentum detection
- New screener with improved accuracy and fewer signals
HMT v3.0:
- Added liquidity factor to enhance trend continuation
- Improved potential for momentum-based plays
- Increased winning probability by reducing entries during peaks
HMT v3.1:
- Enhanced entry confirmation for improved reward-to-risk ratios
HMT v4.0:
- Incorporated buying and selling pressure in lower timeframes to enhance the probability of trending moves while optimizing entry timing and scaling
HMT v4.1:
- Enhanced take-profit (TP) target by incorporating market structure analysis

BSW/USDTKey Level Zone : 0.07800 - 0.08000
HMT v4.1 detected. The setup looks promising, supported by a previous upward/downward trend with increasing volume and momentum, presenting an excellent reward-to-risk opportunity.
HMT (High Momentum Trending):
HMT is based on trend, momentum, volume, and market structure across multiple timeframes. It highlights setups with strong potential for upward movement and higher rewards.
Whenever I spot a signal for my own trading, I’ll share it. Please note that conducting a comprehensive analysis on a single timeframe chart can be quite challenging and sometimes confusing. I appreciate your understanding of the effort involved.
Important Note :
Role of Key Levels:
- These zones are critical for analyzing price trends. If the key level zone holds, the price may continue trending in the expected direction. However, momentum may increase or decrease based on subsequent patterns.
- Breakouts: If the key level zone breaks, it signals a stop-out. For reversal traders, this presents an opportunity to consider switching direction, as the price often retests these zones, which may act as strong support-turned-resistance (or vice versa).
My Trading Rules
Risk Management
- Maximum risk per trade: 2.5%.
- Leverage: 5x.
Exit Strategy
Profit-Taking:
- Sell at least 70% on the 3rd wave up (LTF Wave 5).
- Typically, sell 50% during a high-volume spike.
- Adjust stop-loss to breakeven once the trade achieves a 1.5:1 reward-to-risk ratio.
- If the market shows signs of losing momentum or divergence, ill will exit at breakeven.
The market is highly dynamic and constantly changing. HMT signals and target profit (TP) levels are based on the current price and movement, but market conditions can shift instantly, so it is crucial to remain adaptable and follow the market's movement.
If you find this signal/analysis meaningful, kindly like and share it.
Thank you for your support~
Sharing this with love!
HMT v2.0:
- Major update to the Momentum indicator
- Reduced false signals from inaccurate momentum detection
- New screener with improved accuracy and fewer signals
HMT v3.0:
- Added liquidity factor to enhance trend continuation
- Improved potential for momentum-based plays
- Increased winning probability by reducing entries during peaks
HMT v3.1:
- Enhanced entry confirmation for improved reward-to-risk ratios
HMT v4.0:
- Incorporated buying and selling pressure in lower timeframes to enhance the probability of trending moves while optimizing entry timing and scaling
HMT v4.1:
- Enhanced take-profit (TP) target by incorporating market structure analysis

BSW/USDTKey Level Zone : 0.07265-0.07330
HMT v3.0 detected. The setup looks promising, supported by a previous upward/downward trend with increasing volume and momentum, presenting an excellent reward-to-risk opportunity.
HMT (High Momentum Trending):
HMT is based on trend, momentum, volume, and market structure across multiple timeframes. It highlights setups with strong potential for upward movement and higher rewards.
Whenever I spot a signal for my own trading, I’ll share it. Please note that conducting a comprehensive analysis on a single timeframe chart can be quite challenging and sometimes confusing. I appreciate your understanding of the effort involved.
If you find this signal/analysis meaningful, kindly like and share it.
Thank you for your support~
Sharing this with love!
HMT v2.0:
- Major update to the Momentum indicator
- Reduced false signals from inaccurate momentum detection
- New screener with improved accuracy and fewer signals
HMT v3.0:
- Added liquidity factor to enhance trend continuation
- Improved potential for momentum-based plays
- Increased winning probability by reducing entries during peaks

BSW/USDT: Looking Promising for a Breakout! BSW/USDT: Looking Promising for a Breakout!
BSW/USDT is showing signs that it may be gearing up for a strong upward move. This setup is catching attention as traders anticipate a potential rally in the coming days. Here’s a detailed breakdown to help you navigate this breakout trading opportunity:
Breakout trading tips 💡
1. Confirm the breakout: A true breakout occurs when the price pushes above the resistance level with strong momentum. Look for a decisive candle close above this level, supported by increasing volume. This shows that buyers are in control and reduces the chances of a “fake-out.” Avoid entering too early without confirmation 📊
2. Watch for retests: Breakouts often come with a pullback where the price retests the old resistance level as support. This is a key moment to watch, as successful retests usually confirm the breakout’s strength. Retests can also offer better entry points with reduced risk 🔄
3. Set smart stop-losses: Managing risk is crucial. For breakout trades, a stop-loss placed just below the breakout or retest level can limit potential losses if the breakout fails. This ensures you protect your capital while staying in the game 🛡️
4. Track market sentiment: The overall market trend can influence BSW’s performance. Monitor Bitcoin and other major cryptocurrencies, as their movement can impact smaller assets like BSW. A bullish trend in the broader market can amplify breakout momentum 🌐
5. Set realistic targets: Identify potential resistance levels above the breakout point. These can act as targets for taking profits. Consider taking partial profits at these levels while leaving some position open if the uptrend continues 📈
Trade carefully and use these tips to make the most of BSW/USDT’s promising move. Always remember, this isn’t financial advice—DYOR before making any decisions! 🔥

#BSW/USDT broke the Diagonal Trendline and retesting it in 4-Hou#BSW/USDT broke the Diagonal Trendline and retesting it in 4-Hour TF!
$BSW needs to hold above the trendline. The local resistance level is PML $0.0631 and the support level is PWL $0.0575.

BSWUSDTBiswap (BSW) is currently experiencing a significant price adjustment as it approaches a key support level, where a strong price movement is anticipated. The strategy is to buy and hold at this level, aiming for a rise toward the nearby strong supply zone indicated on the chart. Past upward trends have been halted near this resistance area, so any additional testing of this level could be pivotal and might result in a breakout.
If you find this idea useful, do boost this idea.
Thank you!
