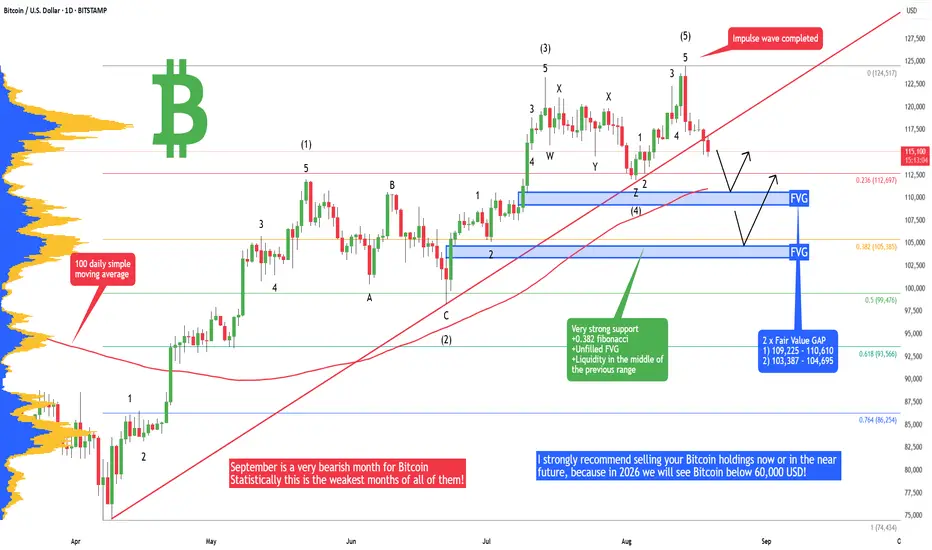
Bitcoin - Avoid BTC at all cost! What is coming will blow you.I strongly recommend selling your Bitcoin holdings now or in the near future, because in 2026 we will see Bitcoin below 60,000 USD! I will tell you why in this analysis.
But first let's look at the local price action on the daily chart and what is going to happen with Bitcoin in the short term. I e
Key facts today
Key stats
About Bitcoin
Bitcoin is the world’s most traded cryptocurrency, and represents the largest piece of the crypto market pie. It was the first digital coin and as such, remains the most famous and widely-adopted cryptocurrency in the world. It's the original gangster in whose footsteps all other coins follow. The birth of Bitcoin was the genesis of an entirely new asset class, and a huge step away from traditional, centrally controlled money. Today, many advocates believe Bitcoin will facilitate the next stage for the global financial system, although this — of course — remains to be seen.
Related pairs
Bitcoin Daily Analysis – The Trend Is Our FriendGood morning, Guys,
I’ve prepared a fresh Bitcoin analysis for you.
🔹 First off, I stand firmly behind my long-term targets of **127,000 – 137,000 – 146,000**. I previously shared these levels with you in a weekly analysis.
🔍 Now let’s shift to the 1-day chart:
What is Bitcoin telling us righ
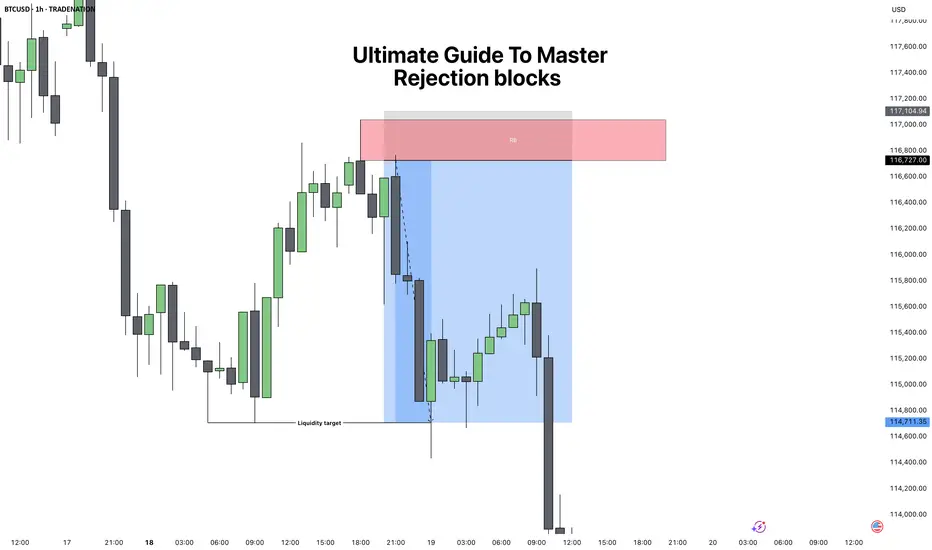
Ultimate Guide to Master: Rejection BlocksRejection Blocks (ICT Concept) – Complete Guide
1. What is a Rejection Block?
A rejection block is a special type of price level that forms when the market attempts to push through but gets denied and reverses. Unlike a traditional order block, which represents accumulation or distribution by i
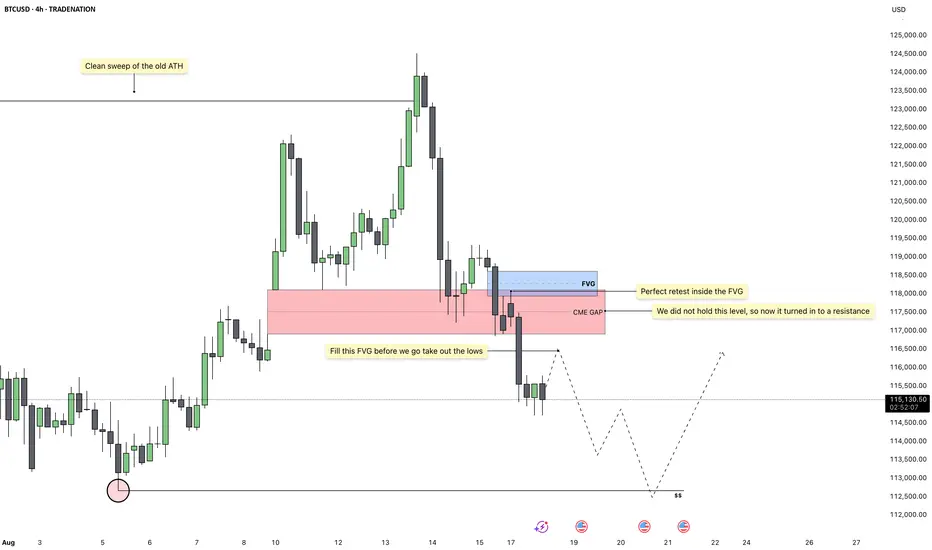
Bitcoin - Bears in Control, Lows AheadBitcoin has recently completed a clean sweep of the previous all time high, which has now given us strong bearish confirmation signals. After the sweep, the market rejected higher levels and failed to sustain bullish momentum, showing clear signs of distribution at the top. This shift in behavior su
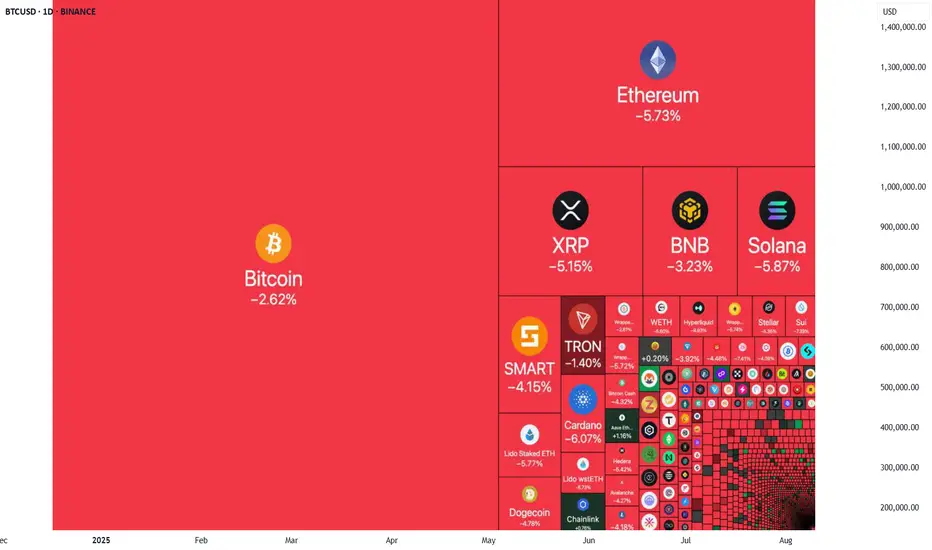
Why Is Crypto Tumbling? A Trader's Guide to the Recent Sell-OffWhy Is Crypto Tumbling? A Trader's Guide to the Recent Sell-Off 📉
🚨 If you're watching the markets today, you've seen the sea of red. Bitcoin, Ethereum, and major altcoins have experienced a significant pullback, leaving many to wonder about the cause.
While sharp drops can be unsettling, for the
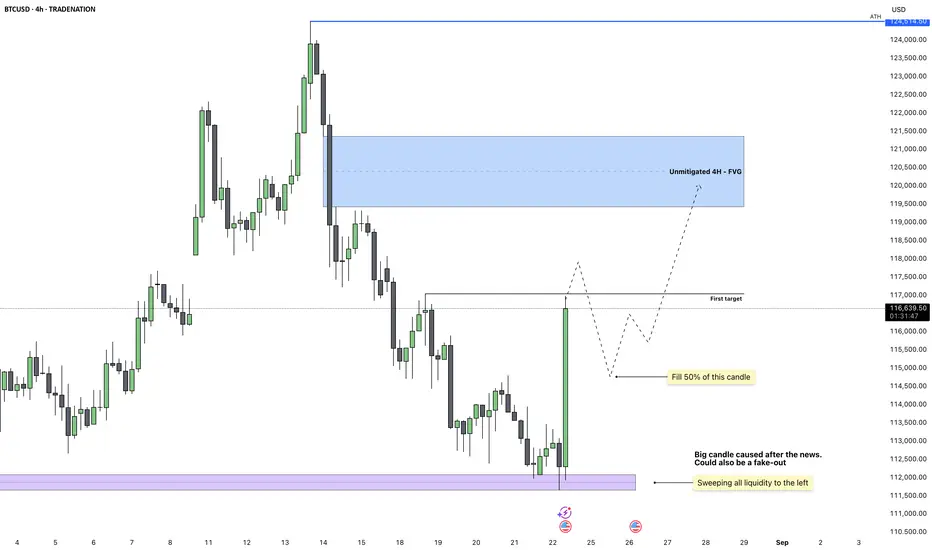
Bitcoin - Can the bulls defend this support?Introduction
After reaching its all-time high, Bitcoin has faced strong rejection, falling from $124.5k down to $113k with notable bearish volume behind the move. On this downward path, several four-hour bearish Fair Value Gaps (FVGs) were left open, signaling areas of inefficiency that the market

Bitcoin - A Deep Sweep Setting Up the Next ExpansionBitcoin just swept the monthly low of August as well as the previous day’s low. This was a clear liquidity grab that lined up with today’s bullish momentum in the market. The strong reaction from this zone shows that buyers were waiting for these liquidity levels to get cleared before stepping in.
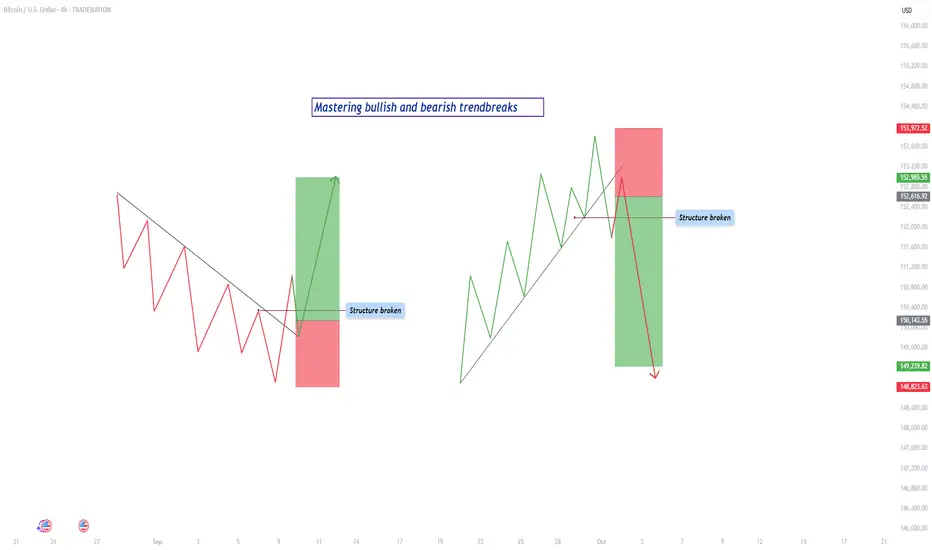
Mastering trendbreaks - How to trade it?In this guide will the trendbreaks be discussed. The following subjects will be explained:
- What is a trend?
- What is a bearish trendline break?
- What is a bullish trendline break?
- How to trade a trendbreak?
- Example
What is a trend?
A trend is the backbone of price action in any market. It
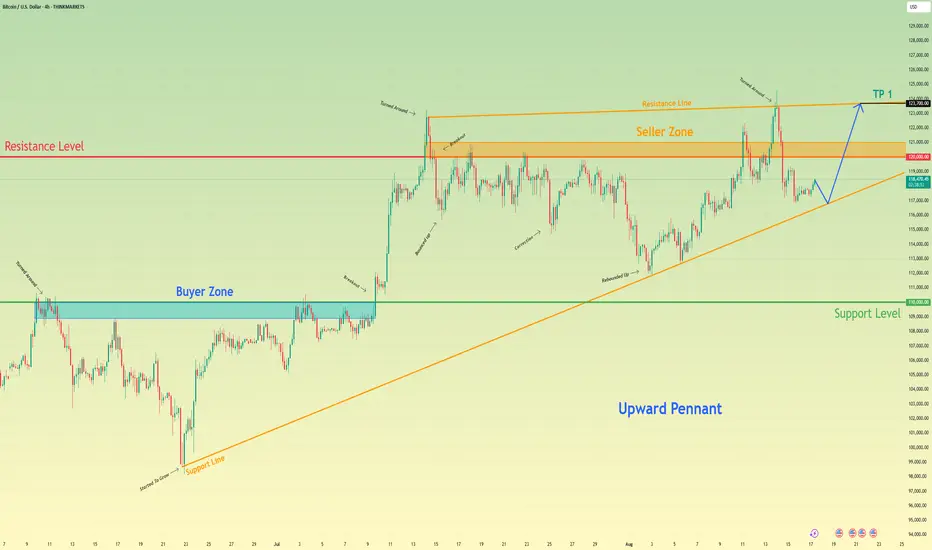
Bitcoin may bounce up of support line and break resistance levelHello traders, I want share with you my opinion about Bitcoin. Following a powerful upward trend and a significant breakout, bitcoin has established a new and higher territory for its price action, leading into the current phase of extensive consolidation. This consolidation has taken the form of a
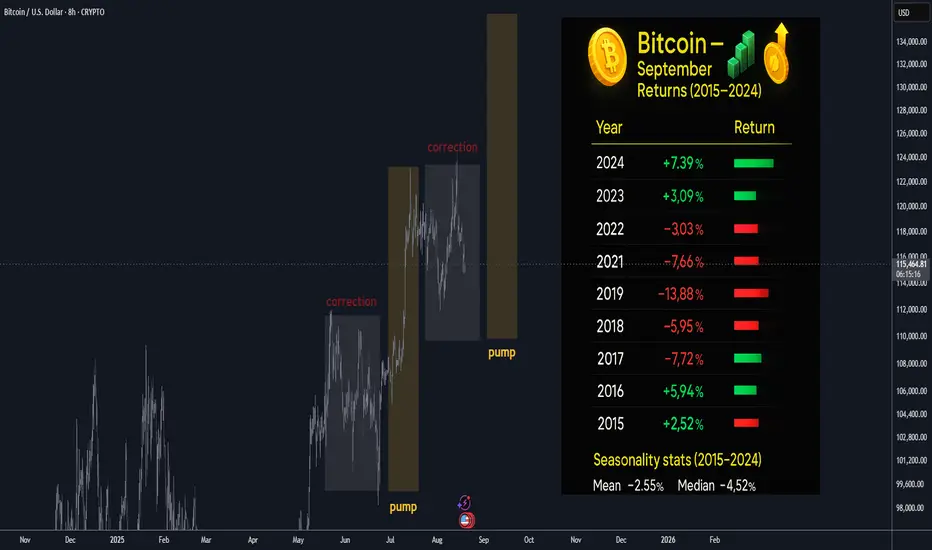
Bitcoin September Seasonality: Correction in progress 100/110K Bitcoin is heading into September after recently printing a new ATH,
historically September is a red month, so expecting further mild losses
heading into September and limited upside, however, once the pattern
and correction is complete, we should see another bull run and mark up.
📊 Bitcoin Septem
See all ideas
Displays a symbol's price movements over previous years to identify recurring trends.
Curated watchlists where BTCUSD is featured.

Gen 1 crypto: from little acorns grow
15 No. of Symbols

Proof of Work: Embracing the crunch
27 No. of Symbols
See all sparks
Discover funds exposed to Bitcoin and find another way to access the coin.
Frequently Asked Questions
Bitcoin (BTC) reached its highest price on Aug 14, 2025 — it amounted to 124,513.5 USD. Find more insights on the BTC price chart.
See the list of crypto gainers and choose what best fits your strategy.
See the list of crypto gainers and choose what best fits your strategy.
Bitcoin (BTC) reached the lowest price of 1,842.6 USD on Jul 17, 2017. View more Bitcoin dynamics on the price chart.
See the list of crypto losers to find unexpected opportunities.
See the list of crypto losers to find unexpected opportunities.
The safest choice when buying BTC is to go to a well-known crypto exchange. Some of the popular names are Binance, Coinbase, Kraken. But you'll have to find a reliable broker and create an account first. You can trade BTC right from TradingView charts — just choose a broker and connect to your account.
You can discuss Bitcoin (BTC) with other users in our public chats, Minds or in the comments to Ideas.