Bitcoin Bitcoin is consolidating above key support around 86,700 after a strong pullback. Price faces short-term resistance near 88,000; a clean breakout could trigger bullish momentum toward 90,000–90,300. Holding above support keeps the upside scenario valid, while a breakdown may invite further downside pressure.
Market insights

#BITCOIN: 2026 Is Loading Possible Drop First And Then Boom! Happy New Year 2026💥🎇
We extend our best wishes for your success and happiness, hoping this year brings the achievement of all your trading objectives.
Let us now analyse Bitcoin's concluding performance for the year 2025👨💻📈
🔺Bitcoin is currently exhibiting strong consolidation, trading within a range of $80,000 to $95,000. It is possible that the price is awaiting robust Non-Farm Payroll (NFP) data to bolster the DXY, which could indirectly lead to a price correction towards the $67,000-$64,000 range. This area is characterized by significant bullish volume and liquidity. A potential swing target could be established above the recent yearly high of $125,000.
Entry, Stop Loss, and Take Profit💭
🔺A strong order block entry is identifiable at $67,000, a critical level for global investors. Upon a price rejection from this vicinity, we anticipate a reversal and subsequent progression towards our designated take-profit target of $135,000.
🔺 A stop loss can be positioned below $59,000 providing a sufficient buffer in the event of a liquidity hunt. This trade may require up to a full year to materialise unless fundamental shifts induce unexpected price movements.
Support and Encouragement 🏆
🔺 We encourage you to comment on and share this analysis if you find it insightful. Your engagement, particularly through likes, provides valuable affirmation of our efforts.
We wish you good year ahead and appreciate your continued support.
Team SetupsFX_

2025 Ends With a Breakout?Year Ends With a Breakout, yes!🚀📈
Bitcoin just delivered what the market was waiting for — a clean breakout back into the channel 🎯
This is how we close the year… with intent.
Key Technicals:
• Major support holding at 88,273 – 88,535
• ATA 200 support confirmed
• Price reclaimed the channel → momentum shifts bullish
• 91,265 is the real breakout trigger
• Above that, 94k–95k comes into play
On the higher timeframe, Bitcoin still looks undervalued around 88k , with fair value closer to the ~101k zone . The market just needs to prove itself above 91k first — step by step, no rush.
Worst-case scenarios sit much lower, but that’s not the base case. Structure > fear.
Macro & Flow:
Banks, gold, and silver are heating up behind the scenes. Liquidity moves in cycles — and historically, some of that money always finds its way back to the best-performing asset . 🟠
Remember: be out under support (88k roughly-88200 exactly). Levels don’t negotiate.
Trading Wisdom 📜
Markets reward patience, not prediction.
AI reacts — humans interpret, adapt, and manage risk .
Trade levels, not emotions.
Disclaimer: Nothing I post is financial advice. It's perspective. I’ve mastered the art of prognosis, but you are the one behind the trigger. Always know your levels, and respect your risk.
One Love,
The FXPROFESSOR 💙

Bitcoin (BTCUSD) – 1-Day Timeframe Tradertilki AnalysisGuys,
There have been many requests for me to share a new Bitcoin analysis, so here I am with my latest one.
My friends, Bitcoin is currently stuck between the levels of $94,500 and $84,000. This consolidation has two possible outcomes: it will break strongly in one direction.
If Bitcoin closes a daily candle above $94,500, it means that major buyers will push the price toward the $104,000 target level. In this case, my target level after a breakout above $94,500 will be $104,000.
If Bitcoin closes a daily candle below $80,000, the first target will be testing the $74,000 level.
This is only an informational Bitcoin analysis for you.
My friends, unlike some who throw out random targets, I analyze the data and follow the major buyers. In trading, the most important thing is to move together with those big buyers.✨
My friends, I share these analyses thanks to each like I receive from you. Your likes increase my motivation and encourage me to support you in this way.🙏
Thank you to all my friends who support me with their likes.❤️

Bitcoin ascending channel and Cups -Next cycle Cup entered ? YES
Bitcoin ascending channel and Cups -Next cycle Cup entered
PA entered channel in march 2017 and has never left, other than to go to ATH.
Bitcoin has spent more time in and above this channel than out of it.
Since entering channel, PA has always bounced off the lower line of channel
For the sake of this post, we are assuming that the current ATH is the final one this cycle.
Reasons why this maybe the case are listed below.
The Cups ( the yellow Semi Circles ) go from the ATH and the tops are Level, same price line. This is called the Neckline.
The Blue day count boxes are ATH to when PA broke through the neckline of the Cup.
2013 - 1211 days
2017 - 1106 days
2021 - 1120 days
The day count in grey boxes, below PA, are from when PA leaves the neckline of the Cup and goes to ATH of that "Cycle"
March 2017 to Dec 2017 - 266 days
Dec 2020 to Nov 2021 = 322 days
Dec 2024 to October 2025 - 308 days - This shows that PA is in the day count Range to have printed a cycle ATH maybe.
Please Note, the Cups are Not EXACT but close enough to show the idea intended here.
For instance, PA followed the Arc of the Cup from ATH in 2017 to when it touched the Lower trend line of the channel. It then bounced.
From the ATH in 2021, PA also followed the Arc of the Cup till it reached the Lower trendline , where it bounced...again.
It maybe worth noting that PA has not yet reached the upper trend line this time, and I have posted about this before, while talking about the "Blue Arc of resistance".....That has rejected EVERY ATH since Bitcoin was created.
IF PA has just been rejected off the latest ATH and is about to enter the Cup again, we have a more shallow drop, till we reach the lower trend line of the channel.
This will be in Feb 2026 at a price of around 60K -> 62K
Why would I think PA has just entered the Next Cup ?
ATH to next ATH day counts have been ( as shown in the upper Grey Day count Boxes )
2013 - 2017 = 1477 days
2017 - 2021 = 1428 days
2021 - 2025 = 1428 days - PA is again in the Day count Range to show that we Have have reached that point
There is Obviously the possibiity that PA will reach another ATH in 2026 and many, including me, say that things have changed and the 4 years Cycle is over.....
We shall see .but until then, I am watching this idea closely.
But again, I will mention, PA has not reached the upper trend line.......it may not.....
What ever does happen, this will be the first time the Tops of the Cup are Not BOTH in the channel, since the channel was fully entered by PA in 2017.
Since entering channel, Every ATH has been one FIB level higher than the previous
2017 just above 1 Fib
2021 just above 1.236 Fib
2015 just above 1.382 Fib
The Next Fib level, the 1.5, sits at a price line of 205700 USD
( 2013 ATH that set the upper trend line of channel was on the 0.618 Fib )
The Fact that PA has reached above that Fib line this cycle, is a day count similar to previous cycles, I do think we may have Topped.....and begun to enter the next Cup.
Just as a side note, Very interesting how From the 2013 ATH to when PA fell out of channel was 266 days ( Orange Box on Left og Main chart)
It was also exactly 266 days From when PA left the Top of the Cup and reached the New ATH in 2017. ( First lower Grey box on the left )
I think we are in for a VERY interesting 2026
HAPPY NEW YEAR to you all

Bitcoin vs Gold: The Big Monthly Retest- Price is now back inside a huge support area that has mattered since 2021.
- In the past, this zone often marked bottoms where Bitcoin stopped losing vs gold and sometimes started a new run up.
- Recent move down = gold stronger than BTC lately.
- The idea on the chart:
- Some sideways “ping‑pong” inside the box ⚾
- Then a possible break higher if buyers defend this zone.
- Trading view of this level:
- Monthly support = slow and noisy , with fake breaks and long wicks.
- If entering here, think small size clear invalidation below the box, and patience.
- A series of higher lows and a break above the short range would be the first hint that BTC is ready to outperform gold again. 🚀

BTC: Bullish January Setup Inside Bear Flag 🔎 Big picture
- BTC is trading inside a downward bear flag channel, but price is holding the lower support line.
- On the daily, candles have formed an small bull flag, showing tight consolidation after a push up.
📍 Trade idea (short‑term long)
- bullish for the next 2–4 weeks, while the lower channel line holds.
- Entry zone :
- Look for longs while BTC stays above the rising support line of the channel.
- Extra confirmation: a daily close above the recent small range highs
- Invalidation:
- If BTC closes below the channel support, idea is cancelled and step aside and wait.
🎯 Profit zones
- First objective: the mid / upper part of the channel, where price reacted before
⚠️ Risk notes
- This is a long inside a larger bear‑flag
- Keep position size reasonable; once/if price reaches the upper channel / 100k resistance, this bullish idea is done and it may become an area to look for reversal

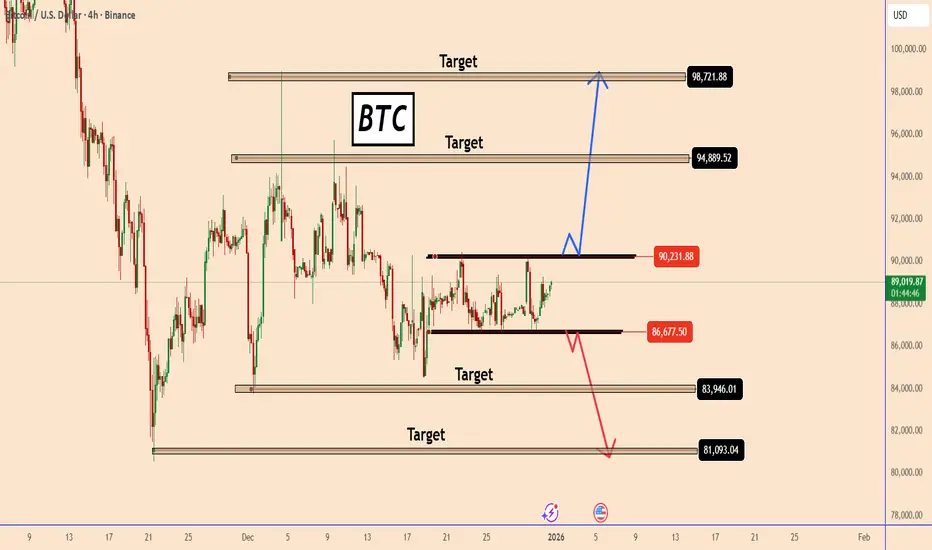
BTC at a Critical Range: Breakout or Breakdown AheadBTC at a Critical Range: Breakout or Breakdown Ahead
BTC is currently consolidating inside a well-defined range, showing clear indecision between buyers and sellers. Price has been respecting both the upper and lower boundaries of this structure, making this zone a key decision area.
Bullish Scenario:
A confirmed breakout above 90,200 could open the way toward higher targets at 94,800 and potentially 98,700, indicating a continuation of the bullish recovery.
Bearish Scenario:
On the other hand, a breakdown below 86,600 would invalidate the range and may trigger a bearish continuation toward 83,900 and 81,000.
Until a clear break occurs, patience is required. The next impulsive move is likely to be strong.
You may find more details in the chart!
Thank you and Good Luck!
PS: Please support with a like or comment if you find this analysis useful for your trading day
Silver Already Showed The Playbook – Bitcoin Might Be Next!When you compare OANDA:XAGUSD and COINBASE:BTCUSD side by side, the similarity in structure is hard to ignore. Silver spent time consolidating, respected its higher lows, absorbed supply, and then expanded aggressively once the structure was confirmed. Bitcoin now appears to be in a very similar phase.
At the moment, Bitcoin is trading around $88,000. The previous all-time high sits near $126,000. The most recent major November low was formed around $80,700.
Importantly, price has not violated the $74,000 macro support, which remains a key level. This alone keeps the higher-timeframe structure intact and bullish.
What we are seeing right now is not panic or distribution. Pullbacks are corrective, momentum remains controlled, and price continues to hold above key demand zones. This behavior suggests compression and energy build-up, not exhaustion.
Silver already executed this sequence cleanly. Bitcoin has not broken down yet, and structurally, it is still behaving like an asset preparing for continuation rather than reversal.
There is, however, a macro risk that cannot be ignored. Rising geopolitical tensions, especially the risk of escalation between Iran and Israel with potential U.S. involvement, could change market dynamics very quickly. Events like these can override any technical structure.
That said, this analysis is based strictly on current price action and confirmed data, not on hypothetical scenarios. As long as price respects structure, the technical bias remains valid.
From a long-term perspective, if Bitcoin continues to respect its macro supports and resumes expansion, the broader upside zone I am watching lies between $200,000 and $280,000.
This is not a buy or sell signal. This is a structural comparison and a technical roadmap.
The market often looks uncertain right before the next major leg begins.
The real question is simple:
Does Bitcoin follow Silver’s playbook, or does macro risk step in first?
Let me know your view below.

The Language of Price | Lesson 11 – Candlesticks + S&R Theory 2Educational Context
This lesson explores hypothetical resistance-based scenarios to illustrate how price behavior can be interpreted in a downtrend environment when candlesticks and support & resistance are analyzed together.
The purpose is to improve market structure reading , not to forecast or promote directional trading.
Scenario 1 – Fresh Resistance Reaction
📍 Resistance
• Fresh formed
🕯️ Candlesticks
• Shrinking candles
• Long wick
• Momentum
🧠 Interpretation
↳ Price reacts to newly formed resistance
↳ Buying pressure weakens into the zone
↳ Momentum begins to align with the prevailing downtrend structure
Scenario 2 – Major Resistance Zone Confirmation
📍 Resistance
• 2 rejections
• Fresh formed
• Huge move away
• Respected as S & R in the past
🕯️ Candlesticks
• Long wick
• Inside candle
• Color change
• Momentum
🧠 Interpretation
↳ Multiple rejections validate the significance of the resistance zone
↳ Temporary consolidation reflects indecision near supply
↳ Structural pressure favors continuation within the broader trend context
Scenario 3 – Strong Rejection From Fresh Resistance
📍 Resistance
• Fresh formed
• Huge move away
🕯️ Candlesticks
• Shrinking candles
• Long wick
• Inverse long wick
• Momentum
🧠 Interpretation
↳ Price rejection appears on both sides of the candle
↳ Reduced upside participation into resistance
↳ Market structure maintains downside control
Key Educational Insight
➕ Candlesticks describe price reaction
➕ Support & Resistance define structural zones
Combined , they provide contextual bias rather than certainty
⚠️ Important
These scenarios do not imply trade execution or guaranteed outcomes.
They are intended solely to support price behavior analysis and structural awareness .
ETHICAL & EDUCATIONAL NOTICE
This content is presented solely for educational and analytical purposes , based on historical price data.
It does not promote or encourage any specific trading method, financial instrument, gambling, leverage, margin usage, short selling, or interest-based activity .
Readers are encouraged to align any financial activity with their own ethical, legal, and religious principles .
⚠️ DISCLAIMER
This material is strictly educational and informational .
It does not constitute financial advice, investment recommendations, or trading instructions.
The author does not provide personalized guidance.
Any decisions made based on this content are the sole responsibility of the individual.

The Language of Price | Lesson 6 – Support & Resistance PracticeLesson Focus: Support & Resistance Types (Practice)
In the previous lesson, we covered the theoretical foundations of Support and Resistance .
In this lesson, we now apply that knowledge to a real market chart .
The goal is to visually understand how different types of Support & Resistance actually appear in real price action , not how to trade them.
🧠 WHAT IS SHOWN ON THE CHART
On this real chart example, the following Support & Resistance characteristics are highlighted:
• Swing High / Swing Low — natural structural turning points
• Minimum 2 rejections — confirmation through repeated reactions
• Freshly formed levels — clean levels with little or no prior interaction from the left
• Huge move away — strong reaction indicating imbalance
• Levels respected as Support & Resistance in the past
These examples illustrate how market structure forms naturally through price behavior , without relying on predictions or signals.
📌 IMPORTANT CLARIFICATIONS
• Support & Resistance are zones, not exact prices
• No level works in isolation
• Context and structure always matter
• Past reactions do not guarantee future results
This chart is used strictly to demonstrate structure , not to predict outcomes or suggest actions.
For best understanding , this lesson is intended to be viewed together with the previous theoretical lesson , as both parts build on each other.
Future lessons will continue developing these concepts step by step through further examples.
ETHICAL & EDUCATIONAL NOTICE
This content is presented solely for educational and analytical purposes , based on historical price data.
It does not promote or encourage any specific trading method, financial instrument, gambling, leverage, margin usage, short selling, or interest-based activity .
Readers are encouraged to align any financial activity with their own ethical, legal, and religious principles .
⚠️ DISCLAIMER
This material is strictly educational and informational .
It does not constitute financial advice, investment recommendations, or trading instructions.
The author does not provide personalized guidance.
Any decisions made based on this content are the sole responsibility of the individual.

The Most Common Entry Mistake Traders Never NoticeMost traders do not lose because their strategy is flawed. They lose because they enter trades before the market has actually shown its intent. This mistake is subtle, easy to justify in the moment, and repeated so often that it becomes invisible. Over time, it slowly erodes consistency and confidence.
The problem usually starts with anticipation. Price approaches a key level, a wick forms, or a candle closes in the expected direction. The setup looks familiar, so the trader assumes the market is ready to move. But at that stage, nothing has been decided. The market is still neutral. What feels like early positioning is often just guessing inside uncertainty.
Markets do not move to reward speed. They move to collect liquidity. Before any meaningful expansion, price typically sweeps highs or lows, triggers stops, and tests obvious areas of interest. Traders who enter too early place themselves directly in this process. When price reverses and stops them out, it feels like bad timing, but structurally the market was doing exactly what it needed to do.
A key misunderstanding is believing that a level being touched equals intent. It does not. A reaction alone is not direction. Real intent only appears after the market responds with structure. This means a clear break in micro structure, decisive movement away from the level, and follow through that shows one side has taken control.
Another common trap is confusing speed with strength. Fast candles into a level can feel convincing, but aggressive moves without confirmation often lead to exhaustion rather than continuation. Strength is not defined by how quickly price reaches a level, but by what it does after that level is tested.
Confirmed entries are patient. Liquidity is taken first. Structure shifts second. Momentum expands third. Often, price returns to retest the area and prove acceptance. This sequence lowers risk and removes emotional pressure from execution.
Early entries are built on hope. Confirmed entries are built on evidence. Waiting does not make you late. It keeps you out of trades that were never ready to work.

2025 Scoreboard: Year’s Top Winners and Biggest LosersIn 2025, money flowed to safety and profits (metals, stocks) 🚀 and away from high risk (altcoins, most crypto) 📉.
Scoreboard: who won 2025? 📊
- 🥈 Silver: +160%
- 🥇 Gold: +65%
- 🧱 Copper: +43%
- 💻 Nasdaq: +20%
- 📈 S&P 500: +16%
- 🧬 Russell 2000: +13%
- ₿ Bitcoin: −6%
- Ξ Ethereum: −12%
- 🪙 Altcoins: −42%
So: metals and stocks = strong green ✅, crypto = mostly red ❌, especially altcoins.
Why metals pumped so hard 🪙🚀
- People wanted safety, not lottery tickets.
When there is fear about inflation, wars, or central banks, investors rush into gold and silver as “real” money that existed for centuries.
- Metals have real‑world demand.
Silver and copper are needed for solar, EVs, electronics etc., so there is constant buying from industry, not just traders.
Result: a huge wall of money moved into metals, pushing them up far more than Bitcoin.
Why stocks did well 📈💼
- Big Tech keeps making real profits.
AI, cloud, chips and software companies are printing earnings, so investors feel comfortable paying higher prices for their shares.
- Easy to access, easy to trust.
Anyone can buy an S&P 500 ETF in their pension account; rules are clear, liquidity is huge. That means constant passive inflows, even when crypto looks scary.
So stocks became the “default” risk trade, while crypto was left aside.
Why BTC and ETH only dipped a bit
- They are the “blue chips” of crypto.
When crypto is out of favor, funds usually sell altcoins first and keep more BTC and ETH, because they are the most liquid and most trusted.
- Still seen as long‑term bets.
Even in a bad year, many investors believe Bitcoin and Ethereum can recover, so they don’t panic‑dump as hard as they do with small caps.
That is why BTC −6% and ETH −12% look “ok” compared with altcoins −42%.
Why altcoins were destroyed 🧨🪙
- Highest risk, so they get sold first.
When people de‑risk, the order is usually: sell altcoins ➝ then BTC/ETH ➝ maybe later reduce stocks. Altcoins sit at the very end of the risk curve.
- Bad tokenomics + unlocks.
Many altcoins still release new supply to VCs, teams, or farmers. In a weak market, those extra tokens just crush price.
- Old narratives, no real users.
A lot of 2021 themes (random L1s, dead metaverse projects, copy‑paste DeFi) lost momentum. With little real usage, there were more sellers than buyers all year.
End result: altcoins became the worst‑performing major asset class of 2025.
The simple lesson for traders 🧠
- In “fear” years, money runs to real assets and profitable companies (metals, strong stocks) 🛡️.
- In those phases, crypto – especially alts – behaves like leverage on risk and gets hit the hardest 💣.
So for the next cycle, think in levels of risk:
cash → metals → big stocks → BTC/ETH → altcoins.
When the macro mood turns defensive again, rotate up this ladder instead of holding the riskiest coins and hoping.

LOOK OUT FOR BITCOIN NEXT HIGH PROBABILITY MOVES SOON!!!🚨BTC HIGH PROBABILITY SETUPS 🚨
* Here We Can See Clearly The Next Potential Moves For BTCUSD Coming Hours/Days.
* Keep Your Eyes Close On Your Trading Positions.
* Happy PIP Hunting Traders.
FXKILLA.

BTCUSD – Ascending Triangle Squeezing Toward ExpansionBTC is coiling inside an ascending triangle, printing higher lows into a flat resistance — a classic volatility compression structure. Each pullback is being aggressively defended, showing growing bullish pressure.
The highlighted green zone marks a high-confluence demand area that has repeatedly acted as support. As long as price holds above this zone, the structure favors upside continuation.
A clean breakout and acceptance above resistance would open the path toward the next liquidity targets. Failure to hold may result in a healthy pullback into support before any larger move.
Market is approaching a decision point — expansion usually follows compression.
Educational idea only. Not financial advice.

Bitcoin (BTC/USD) – 4H Bearish Rejection from Major Resistance Market Structure
Overall Bias: Bearish / corrective
Price is forming lower highs after a strong rejection from the upper zone.
Market is ranging but biased to the downside below resistance.
📉 Key Technical Zones
1️⃣ Major Resistance Zone (Red Area)
Approx. 89,900 – 92,300
Price was strongly rejected here previously.
This zone aligns with:
Previous distribution
Supply imbalance
Any move into this area is likely to attract selling pressure.
2️⃣ Current Price Action
Price currently around 87,900
Forming a weak bullish retracement (corrective move).
The rising move looks corrective, not impulsive → likely a fake breakout or liquidity grab.
3️⃣ Target / Support Zone
Major support around 85,000 – 84,900
Marked as TARGET POINT
This area corresponds to:
Previous demand
Liquidity below equal lows
🎯 Trade Scenarios
🔴 Bearish Scenario (Primary)
Sell zone: 89,800 – 90,500 (inside resistance)
Stop-loss: Above 92,300
Targets:
TP1: 85,400
TP2: 84,900
Strong risk–reward with trend alignment.
🟢 Bullish Invalidation
A 4H close above 92,300:
Breaks resistance
Changes market structure
Opens upside toward 94,000 – 96,000
🧠 Summary
📉 Bias: Bearish below 92.3k
🔑 Resistance: 89.9k – 92.3k
🎯 Downside Target: 85k – 84.9k
❌ Invalidation: Strong close above resistance
If you want, I can also:

12/31/25 - $btcusd - Friends: endure. (happy new year)12/31/25 :: VROCKSTAR :: BITSTAMP:BTCUSD
Friends: endure.
You know i tell u how it is right?
- this year has sucked for digital assets, at large
- honestly. it's not abnormal.
- a lot of charlatans came in, pumped their own bags, printed their own stock and a lot of people who still haven't done work on bitcoin decided they'd try to play catch up
- no such thing
- you don't catch up to bitcoin
- the hard part is you buy it and you hold it
- and if you don't understand that, at this point, you're still not there but i encourage you to keep putting in the time
- bitcoin could be at $70k in a few months. it could be $150k
- but adoption remains squarely: up and to the right
- so while everyone can't endure the months of "pain", take it from a guy that's lived through a decade of the ups and downs... this too shall pass... bitcoin will go higher (probably by a lot)... and then you'll hear the ol' cry of the impatient and junkies all over again "must be nice", "you got lucky", and my favorite "i should have gone all in on X" (where X is the lowest point in the cycle with hindsight).
- the reality is idk what happens in the short term
- actually nobody does
- but i don't take a ST view, i focus on KPIs like hashrate, adoption and technological developments (mixed but still postiive)
- ultimately, this is the price at which you get paid to sit down and do the work
- size and risk manage. i like to find a position size where i'm indifferent if it goes up by x's and down by 50%. i have a plan for both.
- alas, it's all numbers on a screen
- money is a meme
- ultimately it all boils down to relationships. god above all else. family and friends. i count you as my friends.
- and trust is the scarce asset, not bitcoin. don't forget that.
- but in the meme world, bitcoin is a king kong. and don't miss that.
- wishing you all a happy new year.
- 2026 will be great, especially if your attitude adjusts to agree with that point of view. it's up to you. and when it's not, which is a lot of time, so be it. keep rolling. keep showing up. that's what counts. that's what is in your control.
- and go hug someone, tell them you love them.
- and stack sats.
V

Understanding Wyckoff Market CycleBig players can feel the hype, they feel the money that is being poured in so hence the reason we are not seeing any further solid breakouts from here.
They know you want more and they know you do not know how to cut loss....Trade safe..

Two Rules for Crypto Traders in 2026: Less Hype, More DisciplineOver the past years, the crypto market has evolved from a curiosity-driven financial space into a highly competitive environment — where the difference between speculation and disciplined trading has become clearer than ever.
Most traders don’t lose money because they lack technical skills.
They lose because of:
- psychological biases
- unrealistic expectations
- bad information sources
For 2026, I would reduce things to just two essential principles.
🔹 1. Stop following bombastic influencers with a single narrative
If your feed looks like this…
- “Altcoin season is coming”
- “Next 100x coins”
- “How to become a millionaire in 2026”
- “This coin will change your life”
…you are not learning.
You are being emotionally conditioned.
These influencers/content creators are not traders — they are marketers.
Their incentives are:
➡ engagement
➡ clicks
➡ referrals
➡ product sales
Regardless of:
- trend direction
- market cycle
- volume and liquidity
- macro environment
their message remains the same:
“Bullish. Huge upside ahead. Don’t miss the opportunity.”
The real problem?
They never:
- consider alternative scenarios
- discuss risk or downside
- speak in probabilities
- build structured technical arguments
They don’t do analysis.
They sell optimism.
For a trader, exposure to this kind of content:
- increases FOMO
- reduces patience
- destroys discipline
- creates unrealistic expectations
If you see permanent hype — scroll past it .
A sustainable portfolio is not built on motivational narratives.
🔹 2. Use technical analysis and trade major, liquid coins
Most traders don’t blow up accounts because they:
- fail to understand patterns
- misread signals
They blow up because they allocate risk into:
- illiquid tokens
- low-cap projects
- structurally weak charts
- easily manipulated markets
Major, liquid coins:
- respect technical levels better
- have real trading volume
- react more cleanly to structure
- provide clearer probability models
Examples where TA makes sense:
- BTC
- ETH
- SOL
- high-liquidity L1 / L2
Here you can apply:
- trend-following
- support & resistance
- liquidity zones
- volume reactions
- structural break logic
You do NOT need to search for:
❌ “hidden gems”
❌ “next 100x coin”
❌ “unknown early opportunity”
You should be searching for:
👉 discipline
👉 structure
👉 probability
Trading improves when you stop:
- chasing hype
- hunting jackpots
- confusing hope with analysis
Closing Thought
If I had to summarize in one principle:
Less noise. Less spectacle.
More structure. More responsibility.
Success in trading rarely comes from:
❌ catching the miracle coin
❌ believing motivational promises
❌ chasing the next big narrative
It comes from:
✅ disciplined technical analysis
✅ rational risk management
✅ focusing on liquid assets
✅ staying emotionally grounded
Everything else is noise.
Happy New Year!
Mihai Iacob

BitcoinOver the past four weeks, Bitcoin has been trading in a tight range near 90k. The long-term trend remains bearish, so further downside is expected. The nearest target is 80k, with the next one around 60k.
Long-term trend: Down
Resistance level: 95k, 108k
Support level: 60k, 80k

Elise | BTCUSD | 30M – Sell-Side Sweep → Bullish ReversalBITSTAMP:BTCUSD
BTC swept sell-side liquidity around the 86,800–87,000 zone, triggering stop losses before aggressively reversing upward. This impulsive move signals institutional accumulation, not retail buying. The current pullback is corrective in nature, and as long as price holds above the swept low, continuation toward buy-side liquidity remains the primary expectation.
Key Scenarios
✅ Bullish Case 🚀
If price holds above 88,400–88,600, continuation toward buy-side liquidity is likely.
🎯 Target 1: 89,800
🎯 Target 2: 90,200 – 90,400 (Buy-Side Liquidity Pool)
❌ Bearish Case 📉
A 30M close below 87,000 invalidates the bullish setup and signals failed displacement.
Current Levels to Watch
Resistance 🔴: 89,800 → 90,400
Support 🟢: 88,400 / 87,000
⚠️ Disclaimer: This analysis is for educational purposes only. Not financial advice.

2026 - A prosperous year is coming!🙏2026 will be a very prosperous year:
-> Focus on financial health
-> Focus on physical health
-> Focus on social health
and always remember to keep your #LONGTERMVISION
SwingTraderPhil
SwingTrading.Simplified. | Investing.Simplified. | #LONGTERMVISION

BITCOIN It's really game over if it does that..Not much analysis is needed to address today's topic. Bitcoin (BTCUSD) will close tomorrow not only the year (2025) but also the month (December). This is a critical closing as the 1M (monthly) candle is currently red and if it closes this way (i.e. roughly below $90300), BTC will complete three straight red months.
Why this s important? Because during its 2023 - 2025 Bull Cycle, it never had three bearish 1M candles in a row and that could be a definitive confirmation that the new Bear Cycle is already underway.
In fact it would be almost a perfect match with the first 3 months of the previous Bear Cycle, which were also 3 straight red ones (November 2021 - January 2022), also supported by the 1W MA100 (red trend-line). A lifeline of encouragement would be however that, following those first 3 red candles of the previous Bear Cycle, the market found support on the 1W MA100 and rebounded the next two months (but of course only to drop more aggressively in the later stages).
It has to be noted also at this point that 3 straight red months has historically been a strong feature of Bear Cycle activity. In fact only twice Bitcoin displayed 3 straight red months during Bull Cycles: April - June 2021 and July - September 2019.
So if December closes in red tomorrow, would that be GAME OVER for BTC? Feel free to let us know in the comments section below!
---
** Please LIKE 👍, FOLLOW ✅, SHARE 🙌 and COMMENT ✍ if you enjoy this idea! Also share your ideas and charts in the comments section below! This is best way to keep it relevant, support us, keep the content here free and allow the idea to reach as many people as possible. **
---
💸💸💸💸💸💸
👇 👇 👇 👇 👇 👇
