BITCOIN Why nobody talks about this??That was the last indicator standing and now it is as clear as it can get. With last month's candle close, Bitcoin (BTCUSD) has confirmed that it has already started a new Bear Cycle.
The reason is simple and it is one of the most basic trading indicators out there. The 1M MACD was already on a Bearish Cross since October, and November's closing widened the gap to such extent that it is not recoverable anymore.
This has happened every time during a BTC Bear Cycle and in two of the past three cases, it took place while already on the Bear Cycle. History has shown that there is no coming back from this and BTC should start looking for the 1M MA50 (blue trend-line) - 1M MA100 (green trend-line) Zone. If all the Bear Cycle indicators we've shown on analyses since September were early signs, the MACD is conclusive and as mentioned, has confirmed it.
But what do you think? Has the MACD Bearish Cross confirmed the new Bear Cycle beyond any doubt? Feel free to let us know in the comments section below!
---
** Please LIKE 👍, FOLLOW ✅, SHARE 🙌 and COMMENT ✍ if you enjoy this idea! Also share your ideas and charts in the comments section below! This is best way to keep it relevant, support us, keep the content here free and allow the idea to reach as many people as possible. **
---
💸💸💸💸💸💸
👇 👇 👇 👇 👇 👇
Trade ideas

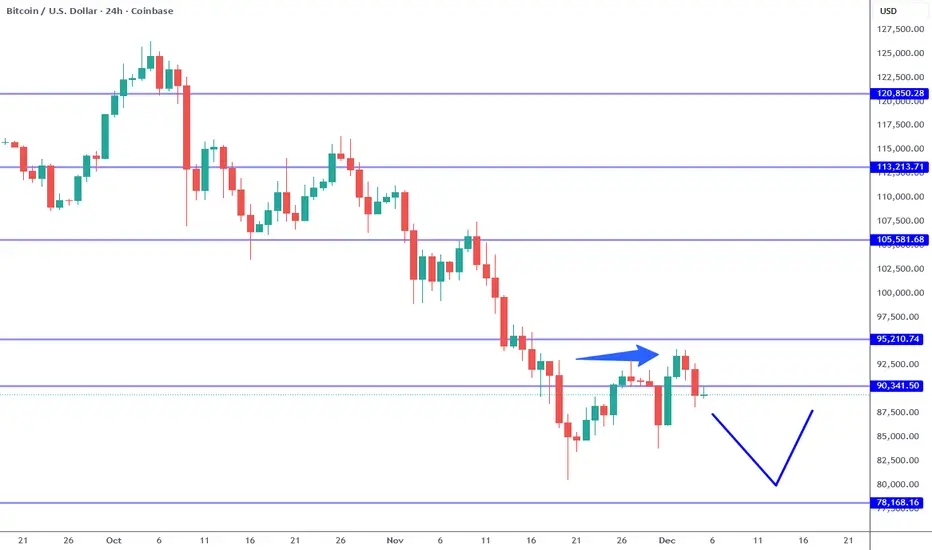
Bitcoin Setting Up For New Low.Bitcoin short term trend is STILL bearish. The 95K resistance defines the structure which implies a lower low is likely to follow in the near future. There is also a failed high off the 93,500 area which suggests further weakness as well (see arrow). IF the 88K area breaks again (trend line break), a test of the 78K low area becomes a higher probability. IF the 95K resistance is broken instead, it cancels out this scenario. It is not about which way I think the market is going to move, it is about what the MARKET chooses. Our job is to look for confirmations, manage risk and adjust to NEW information.
This week we have the FOMC meeting and press conference. This event carries a LOT of weight especially because the Fed is expected to provide guidance on how they plan to shape monetary policy in the near future. The market has priced in another 25 basis point cut, which means what will move the market dramatically is what is said as the press conference. This event has the potential to change the Bitcoin price structure and short term expectation as well. Going into this with opinions is a sub optimal way to mange risk around such an event.
While the major index markets like S&P and Nasdaq are also testing potential resistance levels, IF the Fed unveils and dovish outlook prices will likely grind higher. Also it is important to keep in mind in the coming year (May) Chairman Powell will be out and a new appointee will take over. WHOEVER this person is (still not officially known), WHATEVER they say in interviews, etc., before he is officially the chairman will carry MORE weight than Powell. Important to KEEP in mind for the coming year.
When markets are coming up to an event such as this FOMC, it is better to keep expectations low and take whatever you can get. For example, if you play the bullish trend line on a 4 hour chart for a swing trade, do not look for more than 1:1 trades even for brief swing trades. It is the same if the resistance levels are tested: wait f or confirmations, whether it is a day or swing trade, and keep profit objectives tighter than usual. Markets are likely to become more and more indecisive going into the day of the meeting.
If 78K to 80K support is tested again, watch for a lower low. 73K is a major support. These levels are attractive for investing in my opinion.
Thank you for considering my analysis and perspective.
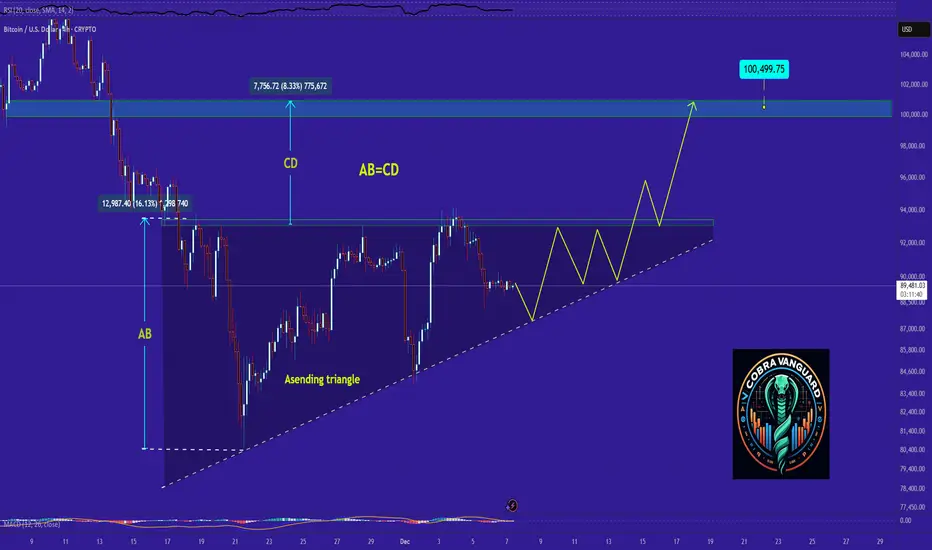
I think the only one Liking my post is me!The price on the 4h timeframe is within an ascending triangle, which can be promising. If the price breaks this pattern with bullish candles, it could easily rise by the distance of AB=CD.
BTCUSD Buyers Defend Support — Market Targets $91,5K — $93K ZoneHello traders! Here’s my technical outlook on BTC/USD based on the current market structure. After a strong bullish recovery from the lower demand area near $83,500–$85,000, the price formed a steady impulsive move upward and entered a consolidation phase inside the marked range below the key $93,000 resistance level. Multiple breakout attempts from the range were followed by corrective pullbacks, showing active participation from both buyers and sellers. Once BTC broke above the range, the price initiated another bullish leg but quickly transitioned into a symmetrical triangle structure, defined by the descending Triangle Resistance Line and the rising Triangle Support Line. Currently, BTC is compressing inside this triangle while holding above the critical $89,500 Support Level, which is acting as the main short-term demand zone. Buyers continue to defend this area, keeping the bullish bias technically valid. The price is now approaching the upper triangle resistance again, hinting at a possible volatility expansion. As long as BTC remains above $89,500, the bullish scenario stays in play. I expect a breakout from the triangle toward TP1 at $91,500, followed by a potential continuation toward TP2 at $93,000, which is the major resistance zone. However, a breakdown below the triangle support would invalidate the setup and may trigger a deeper corrective move. For now, the market remains in a compression phase, preparing for its next directional impulse. Please share this idea with your friends and click Boost 🚀

Bitcoin: Critical Levels Ahead, $106k or $65kHi guys!
The current BTC structure displays a textbook Three Drives Pattern, followed by visible momentum weakness. After the first, second, and third drives completed, price failed to create higher highs, confirming exhaustion. This aligns with the RSI divergence, which began forming during the second and third drives.
Price has now pulled back into a key decision zone. Two scenarios stand out:
Bullish Scenario
If BTC breaks and sustains above 94,393 USD, it would signal renewed strength. This could trigger a continuation toward the upper supply zone around 105,000–110,000 USD, where previous rejection occurred.
Bearish Scenario
Failure to break higher and instead falling below 82,000–83,000 USD opens the path toward deeper retracement. A breakdown confirms the distribution phase after the three drives, exposing the broader support area near 74,500 USD and potentially down to 65,445 USD, which aligns with historical demand.
Disclaimer: As part of ThinkMarkets’ Influencer Program, I am sponsored to share and publish their charts in my analysis.

Radio Yerevan: Is Crypto the Biggest Wealth Transfer in History?Answer: Yes. But not in the direction people hope.
In the last decade, crypto marketing has repeated one grand promise:
“This is the biggest wealth transfer in human history!”
And in classic Radio Yerevan fashion, this statement is both true and misleading.
Yes — a historic wealth transfer took place.
No — it did not empower the average investor.
Instead, it efficiently moved wealth from retail… back to the very entities retail thought it was escaping from.
Let’s break it down: structured, clear, and with just the right amount of irony.
1. The Myth: A Decentralized Financial Uprising
The early crypto narrative was simple and beautiful:
- The people would reclaim financial independence.
- The system would decentralize power.
- Wealth would flow from institutions to individuals.
The idea was inspiring — almost revolutionary.
Reality check: Revolutions are expensive.
And someone has to pay the bill.
In crypto’s case, the average investor volunteered enthusiastically.
2. The Mechanism: How the Transfer Actually Happened
To call crypto a wealth transfer is not an exaggeration.
The numbers speak loudly:
Total market cap peaked above $3+ trillion.
Most of the profit was extracted by:
- VCs who bought early,
- teams with massive token allocations,
- exchanges capturing fees on every trade,
- and whales who mastered liquidity cycles.
Retail investors, meanwhile, contributed:
- capital,
- liquidity,
- hope,
- hype
- and a remarkable tolerance for drawdowns.
It was, in essence, the perfect economic loop:
money flowed from millions → to a concentrated few → exactly like in traditional finance, only faster and with better memes.
3. The Irony: A Centralized Outcome From a Decentralized Dream
Here lies the great contradiction:
Crypto promised decentralization. Tokenomics delivered centralization.
When 5 wallets hold 60% of a token’s supply, you don’t need conspiracy theories — you need a calculator.
The “revolution” looked more like:
- Decentralized marketing
- Centralized ownership
- Retail-funded exits
- And a financial system where “freedom” was defined by unlock schedules and vesting cliffs
But packaged correctly, even a dump can look like innovation.
4. Why Retail Was Doomed From the Start
Not because people are unintelligent, but because:
- No one reads tokenomics.
- Unlock calendars sound boring.
- Supply distribution charts kill the romance.
- Liquidity mechanics are not as exciting as „next 100x gem”.
- And hype travels faster than math.
In a speculative market, psychology beats fundamentals until the moment fundamentals matter again — usually when it's too late.
5. The Real Wealth Transfer: From “Us” to “Them”
The slogan said:
“Crypto will redistribute wealth to the people!”
The chart said:
“Thank you for your liquidity, dear people.”
The actual transfer looked like this:
- Retail bought the story.
- Institutions created the tokens.
- Retail bought the bags.
- Institutions sold the bags.
- Retail called it a correction.
- Institutions called it a cycle.
Everyone had a term for it.
Only one group had consistent profits from it.
6. So, Was It the Biggest Wealth Transfer in History?
Yes.
But not because it made the average investor rich.
It was the biggest because:
- no previous financial system mobilized so many people
- so quickly
- with so little due diligence
- to transfer so much capital
- to so few beneficiaries
- under the banner of liberation.
It wasn’t a scam.
It wasn’t a conspiracy.
It was simply financial physics meeting human psychology.
7. The Lesson: Crypto Isn’t the Problem — Expectations Are
- Blockchain remains a brilliant invention.
- Tokenization has real use cases.
- DeFi is a groundbreaking paradigm.
- And so on
The issue wasn’t the technology.
It was the narrative that convinced people that buying a token was equivalent to buying financial freedom.
Real freedom comes from:
- understanding liquidity,
- reading tokenomics,
- respecting supply dynamics,
- and asking the only question that matters:
“If I’m buying… who is selling?”
In markets — especially crypto — this question is worth more than any airdrop.
8. Final Radio Yerevan Clarification
Question: Will the next crypto cycle finally deliver the wealth transfer to the masses?
Answer: In principle, yes.
In practice… only if the masses stop donating liquidity.

BTC/USD 4H CHART PATTERNThis BTC/USD chart shows a clean breakout above a long-term downward trendline that has been holding the price lower for several weeks. Each previous touch of this trendline resulted in rejection, but Bitcoin has now broken through with bullish momentum, supported by price action moving above the Ichimoku cloud. This shift indicates improving market sentiment and increasing buyer strength. After the breakout, the chart suggests that Bitcoin may continue climbing toward the next major target at 98,850, marked on the right side. If the price holds above the breakout zone and maintains stability above the cloud, the bullish continuation becomes more likely. Overall, the structure favors upside movement toward the highlighted target zone.
If you found this XAUUSD analysis helpful, don’t forget to LIKE 👍 and COMMENT 💬!

Why Bitcoin Endures While 90% of Altcoins Are Born to… Die Over more than five years of observing the crypto market, one clear pattern stands out: Bitcoin survives every cycle, while most altcoins only last a few storms before vanishing. This is not a subjective impression but a reality that any serious investor must understand. Bitcoin and altcoins differ in origin, value, and market strength, and these differences are what allow BTC to endure while most altcoins fade away early.
Bitcoin was created with the mission of becoming “digital gold.” It has a fixed supply of 21 million, operates in a decentralized manner, is not controlled by any single organization, and is widely accepted as a global asset. In contrast, around 90% of altcoins are launched primarily to raise capital, for marketing purposes, or to chase technological trends. Bitcoin exists because of real value; altcoins exist on temporary expectations. When these expectations fade, altcoins die, while trust in BTC grows, allowing Bitcoin to continue evolving and remain a cornerstone of the market.
Another distinction lies in cycles. Bitcoin follows a four-year halving cycle, moving through stages of accumulation, boom, correction, and re-accumulation. BTC consistently surpasses previous highs thanks to its stable cycle and long-term capital, which ensures enduring vitality. Altcoins, however, often experience a short life cycle: launch, hype, pump, dump, and eventual oblivion. Most altcoins stop at the final stage and never return to previous peaks, while Bitcoin always finds a way to reach new highs, demonstrating superior resilience.
Capital backing is also a decisive factor. Bitcoin is accumulated by ETFs, major banks, financial institutions, certain countries like El Salvador, and large corporations such as MicroStrategy. This represents long-term, sustainable capital capable of withstanding market fluctuations. Altcoins, on the other hand, rely mainly on short-term traders, retail FOMO, or social media marketing, making their prices highly volatile when capital exits. Thanks to stable institutional flows, Bitcoin is continuously accumulated and is rarely at risk of “dying” in any cycle.
Token structure creates another clear difference. Altcoins often undermine their own value through tokenomics: early unlocks, large team allocations, high inflation, and weak real demand. Bitcoin is entirely different: fixed supply, no one can mint more, and halving reduces supply over time. This increasing scarcity acts as a shield for its value, explaining why Bitcoin endures over time.
The biggest distinction also lies in the role of each type of currency. Bitcoin serves as the standard and backbone of the market; altcoins are merely “experimental products.” When BTC rises, altcoins revive; when BTC moves sideways, altcoins pump along with the flow; when BTC drops sharply, altcoins crash the hardest. This is a crucial reason for investors to understand that Bitcoin is a real asset, whereas altcoins are interchangeable products that can fail at any time.
Smart investing starts with understanding this difference. Bitcoin survives because of trust, economic structure, and real value, while altcoins exist on expectations, marketing, and short-term capital. To thrive long-term in the crypto market, you should treat Bitcoin as a foundational, enduring pillar and view altcoins as short-term, high-risk opportunities. Once you grasp this rule, you will avoid being swept into “moonshot” projects or holding altcoins that never return to previous highs, and instead invest with strategic vision rather than emotion.

Bitcoin Approaches Key Resistance and Prepares for Its Next MoveHi everyone, Domic here!
This week, the market has provided enough support for Bitcoin to recover, but not enough of a catalyst for a true breakout. The Fed’s 0.25% rate cut continues to favor risk assets, yet investors remain cautious ahead of the December 16 Nonfarm Payrolls report. If labor data weakens, expectations for further rate cuts will rise — a direct tailwind for BTC. On the other hand, an overly strong report could trigger selling near dynamic resistance zones such as the EMA34.
On the news side, the crypto market is lacking major catalysts: no new ETFs, no sudden inflows, and no events on the scale of a halving. Because of that, BTC’s current recovery is driven more by technical factors than by news.
Technically, BTC has bounced from the 86,000–88,000 zone with a clear set of bullish signals: long lower wicks, improving volume, and solid absorption of selling pressure. Price is now testing the EMA34 around 93,846 — a level where BTC has been rejected multiple times since October. This is a crucial “checkpoint,” and if price closes above it on the daily chart, the trend structure will shift significantly. The next target would be the EMA89 near 101,023 — considered the final line of defense for the long-term downtrend. A breakout above EMA89 would almost confirm a new bullish cycle.
In the main scenario, I expect BTC to face mild rejection at the EMA34 and pull back to the 90,500–91,500 zone to gather liquidity before attempting another push. If buyers defend this area well, BTC could break above 94,000 and move toward 96,500 – 98,000 – 101,000, with 101,000 (EMA89) being the decisive level that would open the door to a true “acceleration phase.”

BUY OPPORTUNITY IN BTCThis could be a perfect entry if the price respects the support line that match the level of fib offering a good R: R

BTCUSD Holds Buyer Zone - Push Toward 96,700 LikelyHello traders! Here’s my technical outlook on BTC/USD based on the current market structure. After a prolonged decline, Bitcoin reversed from the Support Level and broke out of the downward channel, shifting momentum in favor of buyers. The price then moved into a consolidation Range, where accumulation formed before a confirmed Breakout pushed BTC higher. Since then, Bitcoin has been respecting the rising Triangle Support Line, forming higher highs and higher lows. Buyers consistently defend this structure, keeping the bullish trend intact despite local corrections. Currently, BTC is holding above the 90,500–88,800 Buyer Zone, which serves as the key demand area maintaining bullish pressure. As long as the price stays above this zone, the upward scenario remains valid. The market is now heading toward the major 96,700 Resistance Level, located inside the broader Seller Zone. A breakout above this level may open the door for further continuation, while rejection could trigger a pullback toward the Triangle Support Line. For now, the structure favors buyers, with 96,700 as the main upside target. Please share this idea with your friends and click Boost 🚀

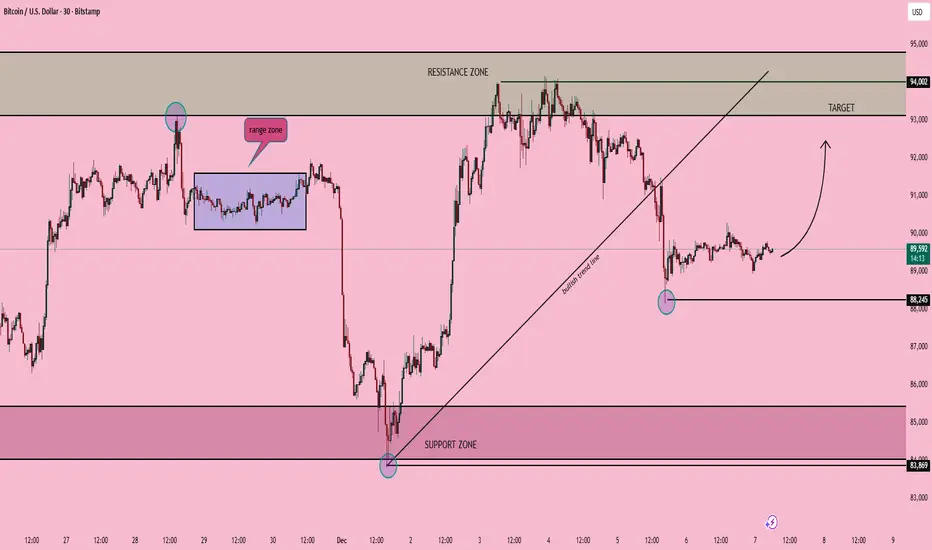
BTC/USD – Support Retest & Possible Recovery PathBITSTAMP:BTCUSD
If Bitcoin maintains support above 88,245, bullish recovery toward the previous 93,500–94,000 resistance zone becomes probable. This zone remains the main area where sellers previously controlled price, so a breakout confirmation is required for further continuation.
A breakdown below this structure exposes deeper liquidity levels toward 83,869 demand, where stronger buy reaction is expected.
Key Scenarios
🔵 Bullish Setup
Hold above 88,245 → break micro-range →
🎯 Target 1 → 91,200
🎯 Target 2 → 93,500
🎯 Target 3 → 94,000 (main resistance)
📌 Invalidation if price closes below 88,245
🔴 Bearish Setup (If Support Fails)
Break below 88,245 → continuation downwards
🎯 Target → 85,500
🎯 Target → 83,869 major demand
Possible reversal expected from demand block.
Current Levels to Watch
Resistance: 93,500 → 94,000
Support: 88,245
Demand: 83,869
⚠️ This is an educational analysis, not financial advice.
BTC: Liquidity Sweep SetupBTC: Liquidity Sweep Setup
Bitcoin continues to operate inside a broad equilibrium zone after completing a prolonged downward phase earlier in the month. The decline lost momentum as price entered a high-participation area, where trading activity became increasingly balanced and rotational. Since then, the market has developed a wide consolidation band, signaling a temporary standoff between directional conviction and liquidity accumulation.
Recent sessions show price repeatedly rotating through the center of this zone, forming alternating impulses that lack continuation. This pattern reflects a market focused on collecting orders rather than trending. Each short-lived push quickly transitions back into the range, indicating absorption on both sides and limited willingness from participants to sustain directional movement.
The lower portion of the range has begun attracting more activity, suggesting interest from larger players seeking efficient fill zones before any expansion. Price behaviour here is characterized by controlled sweeps, shallow recoveries, and frequent re-tests of the mid-band — signs of liquidity harvesting rather than aggressive distribution.
Forward behaviour on the chart implies that the market may first dip into the lower liquidity pocket to finalize order collection. Once this pocket is satisfied, conditions become favourable for a transition into an expansion phase targeting the upper boundary of the current equilibrium. This type of structure is common before major repricing, as it reflects the buildup of untriggered positions awaiting execution.
Overall, Bitcoin is in a preparation phase where energy is being stored, volatility is compressing, and liquidity is reorganizing. The next significant development is likely to emerge once the market completes its sweep of inefficient areas inside the range and finds a stable base for expansion.

BTC Isn’t Bottoming — It’s Bargaining: Why 75k Still Makes SenseAs I mentioned in my previous analysis, the idea that “BTC has bottomed” simply doesn’t convince me.
And let’s be honest: when a true bottom forms, you won’t see every account on social media announcing it. Markets don’t work that way — especially crypto, where optimism is often weaponized.
From a structural perspective, the entire rise from the 80k zone looks like a textbook corrective move. Yes, we had a perfectly normal rebound into the 94k area, but everything that followed has been classic corrective behavior:
- Mostly ranging price action
- Repeated spikes into 95k that were quickly sold
- Clear overlapping structure
- A bearish flag, which statistically favors continuation lower
If we also consider the four-month distribution phase between 110k–120k, it becomes even harder to justify a bullish reversal narrative. Distribution of that scale rarely resolves into instant trend reversals — instead, it usually marks the beginning of a deeper cycle shift.
So from a psychological standpoint, the crowd is still bargaining — trying to convince themselves the trend is intact, even though the structure keeps printing lower-probability bullish outcomes. That cognitive dissonance is exactly what fuels bear markets.
My view remains unchanged: 75k remains the primary downside target.
And for me, nothing changes unless BTC manages to stabilize above 100k — not just wicks above, but hold with clear buying interest.
Until that happens, selling rallies is the only rational play.

Do you think I'm joking ???As you can see, the price is forming two bullish patterns on the 4h timeframe, If my view is correct, btc will rise to $100k
And if this pattern is correct and breaks, higher targets are possible.
previous analysis

Perfect Execution - Waiting for Confirmation Saves AccounsKey levels attract attention, but attention alone rarely produces good trades. A level gains meaning only when price shows how it behaves around it. Many traders understand where important levels are, yet still lose money because they enter too early, assume a breakout will continue, or anticipate a reversal before the market confirms it.
Patience at these levels is what separates disciplined execution from unnecessary losses.
A key level acts like a pressure point. Liquidity gathers above highs, below lows, and around clear support or resistance.
When price approaches these zones, it does not move cleanly. It probes, sweeps, hesitates, or accelerates depending on who holds control. Entering at the first touch is often an emotional decision disguised as confidence. Entering after confirmation is a structured decision grounded in evidence.
Confirmation begins with a reaction. A legitimate bounce or rejection has intent behind it. You will see displacement, cleaner momentum, or a defined shift in micro-structure. A candle wick alone is not confirmation.
A single green or red candle is not confirmation. Confirmation comes when the market shows that a level is respected or rejected with conviction, as several conditions align.
One of the clearest signs of confirmation is the break of micro-structure after the level is touched. If price sweeps a low and then breaks a minor high, the narrative changes. The same applies to resistance: a sweep followed by a failed attempt to push lower is evidence of buyers stepping in.
This structural shift shows that the reaction is more than a random bounce.
Another layer of confirmation is the retest. Strong moves often return to the level they broke to validate participation.
Traders who enter before this retest expose themselves to unnecessary volatility. Traders who wait allow the market to prove that the move is real, not a trap.
The retest reduces risk naturally and improves the reward-to-risk ratio without changing the strategy itself.
Patience does not slow you down. It filters out trades that look attractive but lack substance. Key levels attract liquidity, manipulation, and emotional behaviour.
Waiting for confirmation keeps you grounded when the market is trying to provoke a reaction. It prevents you from turning strong levels into weak trades through premature entries.
The goal is not to catch the exact top or bottom of a move. The goal is to participate in moves that show clear strength and clear intent.
When you treat key levels as decision points rather than entry signals, your trading becomes structured, disciplined, and far more consistent. Patience is not passive. It is an active skill that protects your account and elevates your execution.

BTCUSD Next Selling Move Analysis
The chart points to a Target Level (purple zone).
Below that sits a Strong Support Level (blue zone).
Short Idea (Based on the chart’s logic)
This is an interpretation — not a recommendation:
1. Weak High = Liquidity Zone
A weak high often suggests price may reverse after grabbing liquidity — which seems to be what the chart implies.
2. Market Structure Shift
The drawn line shows a lower high forming, suggesting bearish structure.
3. Short Bias Trigger
A short bias may be considered after confirmation, such as:
Break of minor support beneath the weak high
Retest of that broken level
Bearish rejection (wick rejections, bearish candle close)
4. Possible Target Areas
First target: Purple “Target Level” zone — likely a demand area or imbalance.
Final target: Blue Strong Support Level — major liquidity zone.
❤️ please support with Boost and Comment I will be Glad ❤️

Bitcoin Analysis - Still looks weak
The bounce from the 0.786 level initially indicated that there could be some demand around deep retracement levels. However, the inability to hold above 0.618 undermines the case for a strong reversal. In classical technical‑analysis logic, losing 0.618 swing reclaims often suggests the corrective move may extend further downward, or the price may remain range‑bound for some time.
Given that BTC now trades under a key resistance band (US$93–$94 k) and market sentiment remains cautious, the structure resembles a tense consolidation or distribution.

BTCUSD; Heikin Ashi Trade IdeaLast time we had big divergence on MACD and weekly TF, we had big correction...

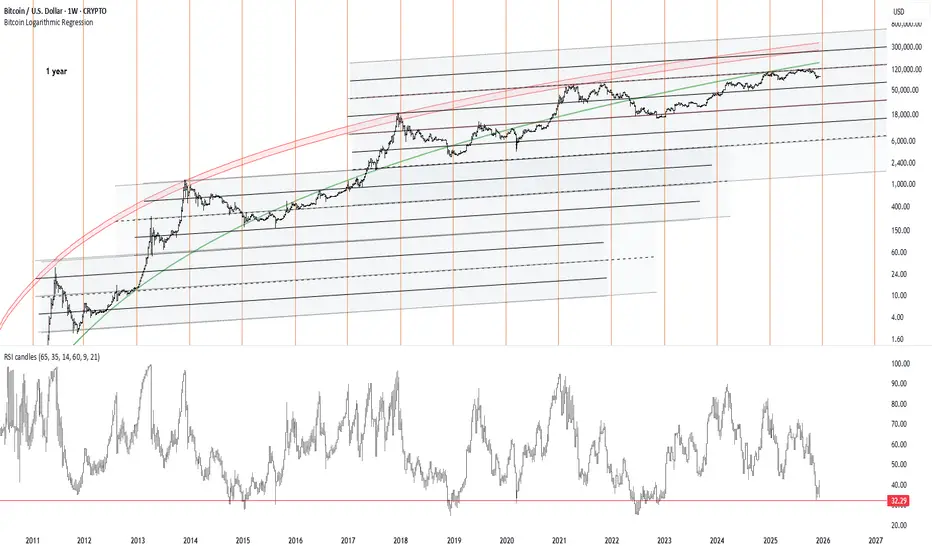
Bitcoin: The Cycle Is Approaching Its Breakout PhaseBitcoin: The Cycle Is Approaching Its Breakout Phase – “Time Is Tightening, the Band Is Compressing”
LETS START =)
This chart ultimately tells one story:
Bitcoin has never abandoned its 4-year rhythm; it simply reduces volatility each cycle while grinding toward the upper logarithmic band.
Let’s decode the structure step by step.
1) Logarithmic Regression Bands: “Not a trendline, a structural corridor”
The grey–black bands represent a logarithmic channel that Bitcoin has never broken below since 2011.
There are three key layers:
A) Lower-Mid Band (Cycle Floor Support)
→ The bottoms of 2012, 2015, and 2019 all touched this region.
→ Today this zone sits around ~43k–55k.
The fact that the 2022 bottom formed here already confirms that the structural low of this cycle is behind us.
B) Upper-Mid Band (Pre-Top Compression Zone)
→ In every major cycle—2013, 2017, 2021—price consolidated beneath this band right before the final blow-off phase.
→ In 2025, BTC is again compressing inside the same zone.
This implies:
Bitcoin always “stalls” once before the true cycle top.
This stall is happening now.
C) Upper Red Band (Macro Top Territory)
→ All mega tops in 2013, 2017, and 2021 hit this exact red logarithmic curve.
→ The projection for the 2025–2026 cycle peaks lands here again:
185k – 260k.
The red curve marks the end of the road.
2) Cyclical Time Markers (Orange Vertical Lines): “The 1-Year rhythm repeats”
The orange verticals represent Bitcoin’s 1-year hybrid time geometry.
Every yearly block follows the same pattern:
Momentum compresses
Volatility dries up
RSI drifts toward the floor
Final trend expansion happens in the last 3–4 months
Right now, as we enter late 2025:
The time marker again aligns with a cyclical weakness window
Which historically precedes major upside expansions
This mirrors 2012, 2015, 2019, and 2023 perfectly.
The chart is saying:
“Your time window is closing. This is the reset before expansion.”
3) RSI at 32: “Cycle-bottom signal”
The horizontal red line tracks historical cycle-bottom RSI values.
An RSI in the 32–35 range marked:
2011 bottom
2015 bottom
2019 bottom
2023 bottom
In late 2025, RSI is back in the same zone.
This tells us:
The trend is not breaking; momentum is resetting.
This is the last cooldown before the expansion leg.
Bitcoin has never topped a macro cycle with weekly RSI this low.
Every blow-off top occurred with RSI between 70–90.
RSI is saying clearly:
“The cycle top is not in. This bull market is not finished.”
4) Price Behavior: “Compression beneath upper band = calm before ignition”
Bitcoin is currently:
Squeezed between the upper-mid grey band
And the upper red logarithmic curve
Forming the tightest consolidation since 2021
This structure resembles:
→ Mid-2016 (right before the 2017 parabolic run)
→ Summer 2020 (right before the 2021 surge)
Once again, BTC is behaving like a coiled spring—fully compressed, waiting for release.
5) Cyclical Projection (Cryptollica style):
Assuming historical structure repeats:
Short Term (1–3 months):
RSI bottom → sideways grind → momentum reversal
Medium Term (3–9 months):
Break above upper-mid band
→ explosive flow into 85k–110k range
→ sentiment flips fully bullish
Macro Top Window (first half of 2026):
Touch of the upper red band
→ 185k–260k macro top potential
This band has never failed across 3 full cycles.
----------------------------------------------------------------
This chart is not showing weakness.
It is showing a textbook cyclical reset.
**“The 2026 blow-off top hasn’t even started.
This is the final compression…
the final breath…
------------------------------
2013-2018
2021-2026
BITCOIN This is the 4H Golden Cross that Bulls need at all costsBitcoin (BTCUSD) has been on a slow rebound following the 1W MA100 (red trend-line) test and is close to forming a 4H Golden Cross for the first time in more than 2 months.
However a similar rebound attempt in December 2021, at the start of the BTC's previous Bear Cycle, after also dropping by -39.50% from the top (against today's -36.20%), failed to form a 4H Golden Cross the 'last minute' and the market resumed the bearish trend towards a new Low, completing a -50.34% total decline.
So far the 1D RSI is similar to December 2021 but there is one key difference. Now Bitcoin has already tested its 1W MA100 (and rebounding) while on the previous Bear Cycle it only came close to it in February 2022. So will that favor and support the market for a little while and make that 4H Golden Cross or the 1D RSI and -36.20% identical drop fractal will push it lower? In the first case, the market will look for a 1D MA200 (black trend-line) test around $105k, which is what happened in March 2022, while in the second for a -47.30% total drop around $67000.
One thing is for sure, if Bulls want to see some relief for some time, they have to defend that 4H Golden Cross.
Which scenario do you think will prevail? Feel free to let us know in the comments section below!
---
** Please LIKE 👍, FOLLOW ✅, SHARE 🙌 and COMMENT ✍ if you enjoy this idea! Also share your ideas and charts in the comments section below! This is best way to keep it relevant, support us, keep the content here free and allow the idea to reach as many people as possible. **
---
💸💸💸💸💸💸
👇 👇 👇 👇 👇 👇

BITCOIN New LOWS SOON 4th wave has ended ?I had thought we would see 96/101 but the rally seems to have formed a abcde if we can NOT get above 96k fast I would look for this next wave down to have started .I have posted the math as to why 83/84 was important and why we stopped at 80k Fib relationships since the high within the structure down . What I am looking at now is this break could see 73900 to 71100 now LIKELY target is 71100 zone best of trades WAVETIMER

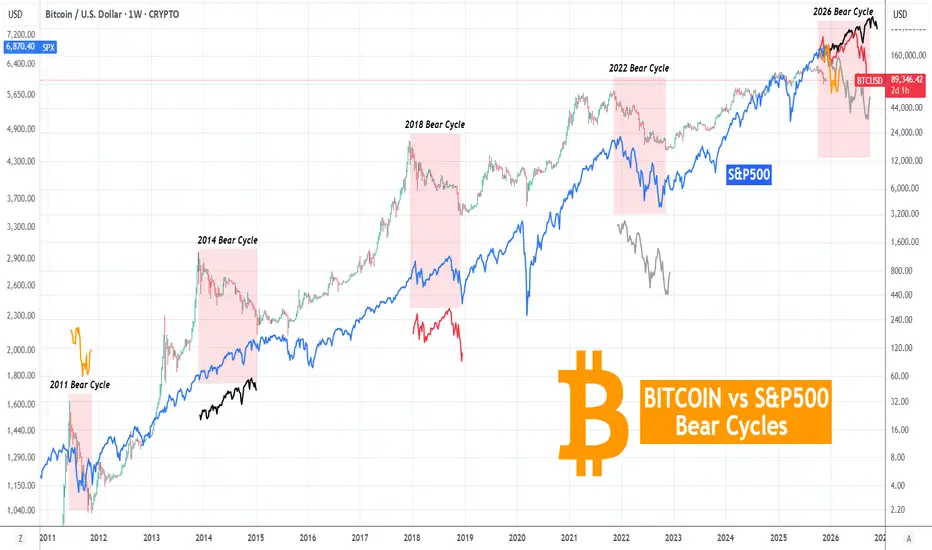
BITCOIN vs S&P500 Is the Bear Cycle correlation a myth?Bitcoin (BTCUSD) has entered a new Bear Cycle while the stock markets remain near their All Time Highs (ATH). The general notion is that when BTC starts a Cycle (either Bull or Bear), the stock market, which on this particular analysis is the S&P500 (blue trend-line) follows suit. But how much truth is in it?
Here we see those Bear Cycles since 2011. As you can see in 2011 and 2022 both BTC and the S&P500 dropped around the same time. In 2018 even though both started falling, the S&P500 recovered shortly after, even made new ATH but dropped again remaining volatile. On the other hand in 2014, the S&P500 kept rising, even though BTC was in a Bear Cycle.
As a result, the above notion isn't 100% accurate, not entirely a 'myth' but for sure not a certainty. We even plotted all previous S&P500 sequences during BTC's Bear Cycle, on today's Cycle and as you can see the worst case scenario based on that is a 2022 type correction (grey fractal), which would bring the index back to the April 2025 lows. Bitcoin will most likely have a typical Bear Cycle, especially with the last two (2022 and 2018) being almost identical.
So do you think the Bear Cycle correlation is a myth or not? Feel free to let us know in the comments section below!
---
** Please LIKE 👍, FOLLOW ✅, SHARE 🙌 and COMMENT ✍ if you enjoy this idea! Also share your ideas and charts in the comments section below! This is best way to keep it relevant, support us, keep the content here free and allow the idea to reach as many people as possible. **
---
💸💸💸💸💸💸
👇 👇 👇 👇 👇 👇