CAD/CHF: One More Wave Ahead?!📈CADCHF is poised to continue its upward trajectory, reaching new highs.
A bullish breakout from the neckline of the ascending triangle pattern on the 4-hour timeframe indicates a strong trend-following bullish signal.
We anticipate with high probability that the price will soon reach the 0.5763 level.
Trade ideas

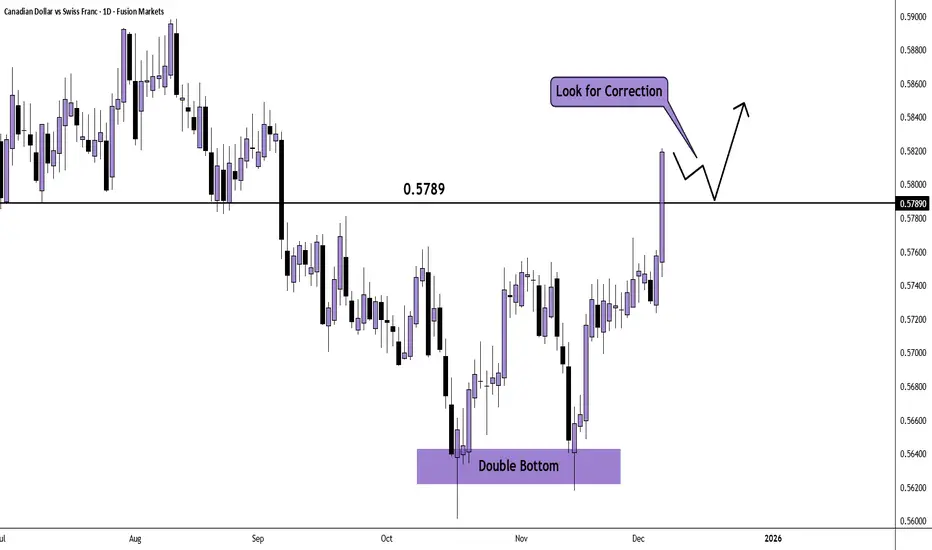
CAD/CHF Daily AnalysisWe saw a strong move from all CAD pairs on Friday after the positive employment data.
We may possibly see a correction now.
Looking to the left, 0.5789 could be an area to watch which acted as support through July and August.
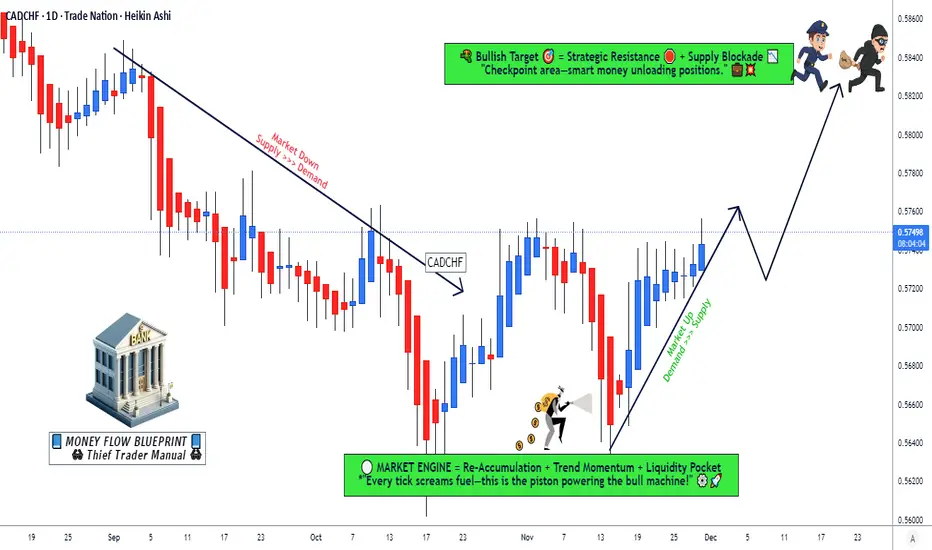
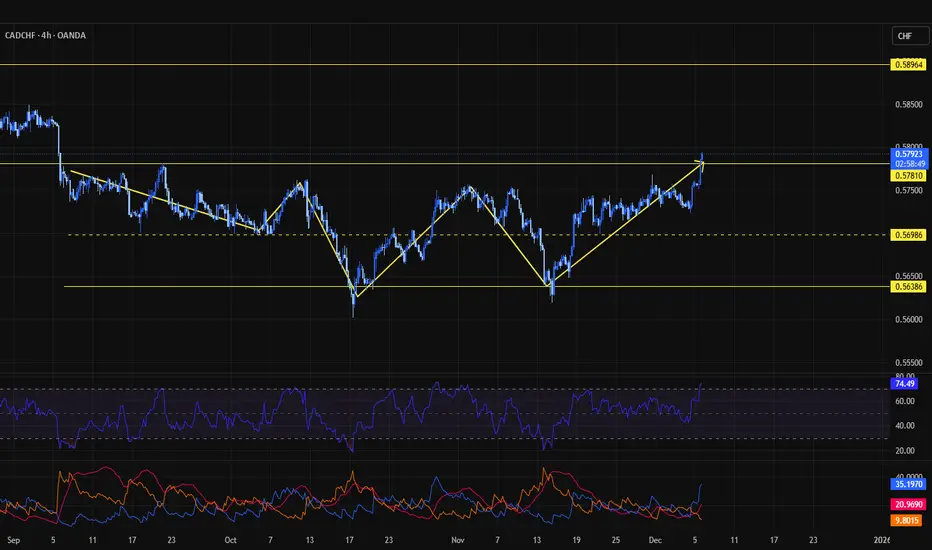
Update CADCHFThis currency pair has an interesting history on the weekly timeframe. If you check, you’ll see that from 2004 until now it has been in a downtrend, which is quite fascinating. Right now, these two touches you see represent the lowest price of CAD against CHF, and this area has no past data on the chart. That in itself is challenging because you have neither history nor future—it's just you and the market. Honestly, the only idea that comes to my mind for this chart is to apply a range strategy within the range that has formed. What would you do if you were in this situation?
Thank you for your support — boosting the post helps more traders see the analysis, grow our community, and learn from each other. 🙏📉

CAD/CHF BEARS ARE STRONG HERE|SHORT
Hello, Friends!
CAD-CHF uptrend evident from the last 1W green candle makes short trades more risky, but the current set-up targeting 0.571 area still presents a good opportunity for us to sell the pair because the resistance line is nearby and the BB upper band is close which indicates the overbought state of the CAD/CHF pair.
Disclosure: I am part of Trade Nation's Influencer program and receive a monthly fee for using their TradingView charts in my analysis.
✅LIKE AND COMMENT MY IDEAS✅

CADCHF TRADE SETUPWait for retest the entry level and bullish momentum then take a trade for Buy otherwise skip this setup
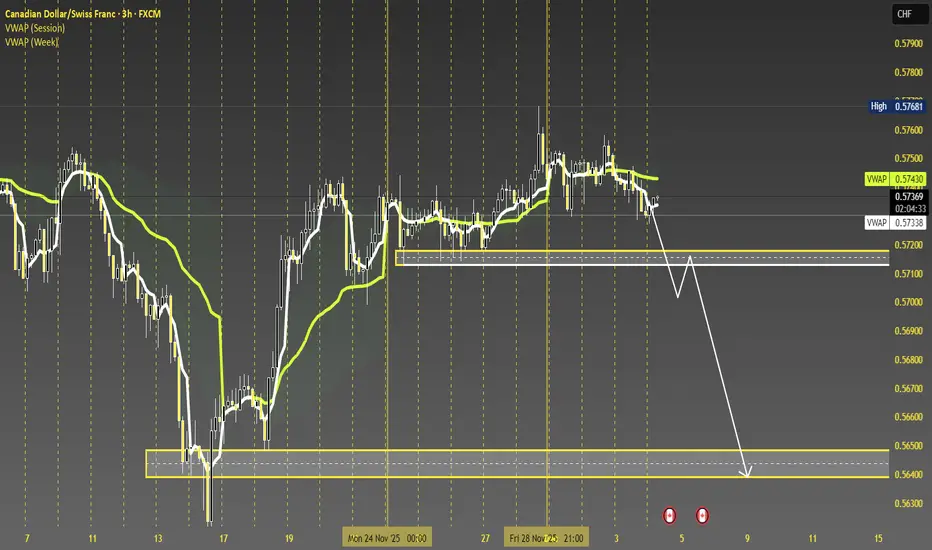
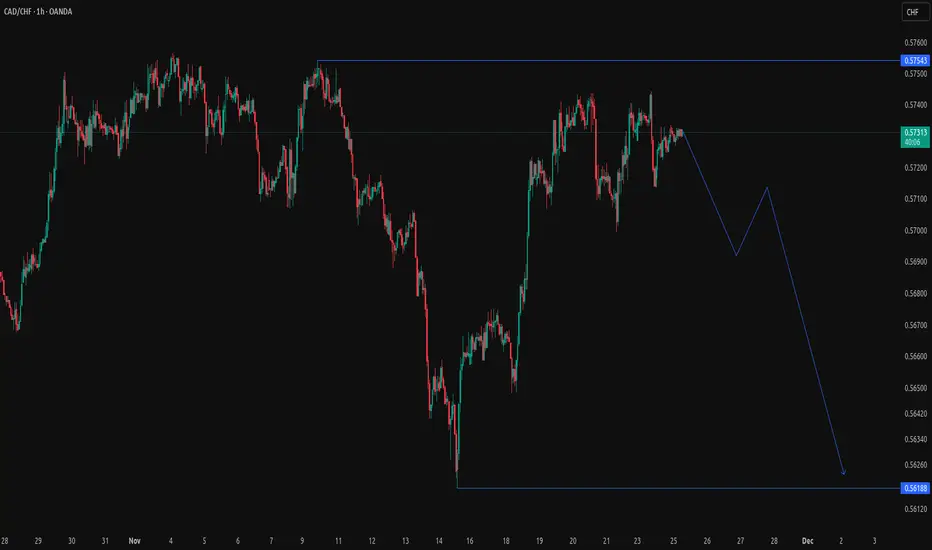
Update CADCHFSince our analysis yesterday, the price hasn’t changed much, and our outlook is still a short position toward the bottom of the channel. A break of the trendline that has formed, followed by a pullback, could give us a good trigger. If the price breaks to the upside instead, we’ll reassess the situation and decide at that moment whether to enter a long position or not.

CAD/CHF Technical Roadmap for a Potential Upside Push📌 CAD/CHF Swing Trade — Thief Layer Strategy | Bullish Opportunity 🚀🇨🇦🇨🇭
Asset: CAD/CHF — “CANADIAN DOLLAR VS SWISS FRANC”
Market Type: Forex Swing Trade Setup
📈 Trade Plan (Bullish Bias)
This setup is based on Thief Strategy Layer Entries, a method that scales into the market using multiple limit orders to capture value zones and reduce average entry cost.
✅ Entry Plan — “Thief Layer Style”
Using multiple buy-limit layers, entering at:
0.56800
0.57000
0.57200
(You can increase or modify layers depending on your own market confidence and capital rotation.)
🛡️ Stop Loss (Manage With Discipline)
Thief SL: 0.56600
Dear Ladies & Gentlemen (Thief OG’s), adjust your SL according to your personal risk tolerance and strategy.
I am NOT recommending you to use my SL as your fixed level — protect your capital the way you see fit.
🎯 Take Profit (Escape With Profits)
Price faces moving-average resistance, overbought signals, and potential bull traps, so take profits without hesitation.
Primary TP: 0.58400
Again — this is NOT a fixed TP for you.
Make money and take money based on your own risk and your own timing.
📚 Market Logic & Why Bullish?
CAD is gaining momentum due to improved risk sentiment.
CHF weakness appears in correlated safe-haven flows.
Technical structure shows bullish demand zones aligning with MA support.
Layered buys allow high flexibility during any intraday volatility.
🔍 Related Pairs to Watch (Correlations & Key Notes)
💵 USD/CHF
When USD strengthens and CHF weakens, it often pushes CAD/CHF upward as well.
Watch for risk-on sentiment and U.S. macro prints — they indirectly drive CHF’s safe-haven behavior.
💵 CAD/JPY
A strong CAD here often confirms broad Canadian Dollar strength.
If CAD/JPY is bullish, it reinforces confidence in CAD/CHF longs.
💵 USD/CAD
If USD/CAD is falling, that means CAD is strengthening — supportive for CAD/CHF upside.
Oil prices also influence CAD heavily; rising oil generally lifts CAD.
💵 EUR/CHF
Good for tracking CHF strength/weakness cycles.
If EUR/CHF is climbing, that shows CHF weakening — positive for CAD/CHF bulls.
🔥 Final Words (Thief OG Style)
Stay patient. Let the layers fill.
Protect your capital. Book profits smart.
Trade your plan — not someone else’s emotions.

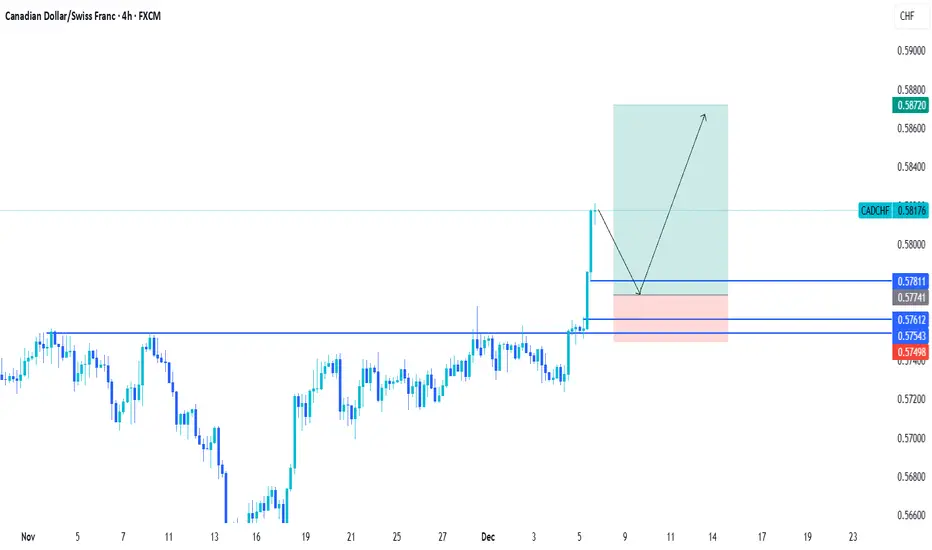
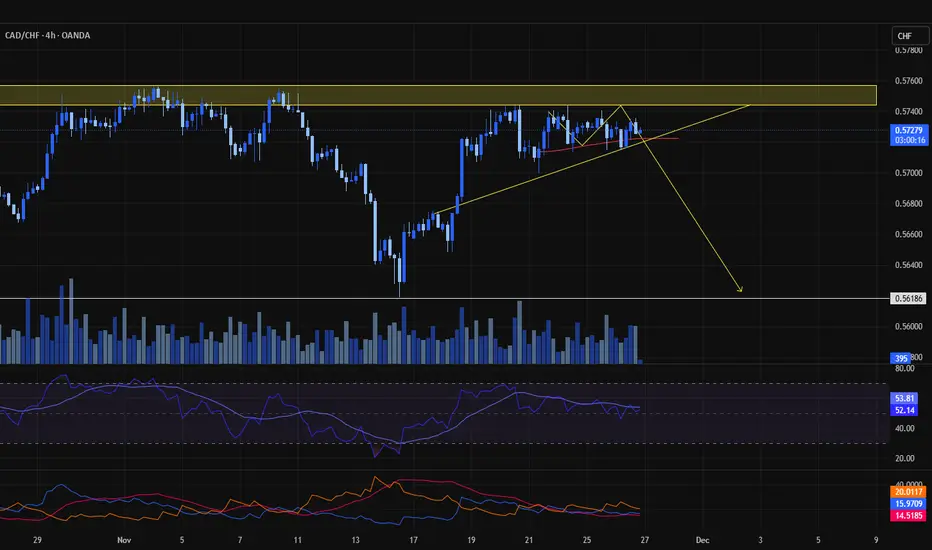
Update CADCHFA very strong and important resistance is located at **0.57400**, and the price is still reacting to it.
**Plan A**:
Rejection from the resistance level, similar to previous behavior on the chart.
Our target in this scenario would be the **0.56565** price area.
**Plan B**:
A breakout above the resistance.
Why is this our secondary plan? Because it goes **against the current trend**, and entering a long position requires **both candlestick confirmation and momentum confirmation**.
For now, the price is still struggling with the resistance, so we need to wait and see how it plays out.

Cadchf long!Since 2003 cad chf have been falling, trading in a channel. Now, we are at the lower boundary of that channel. I expect cadchf to buy towards 0.70000

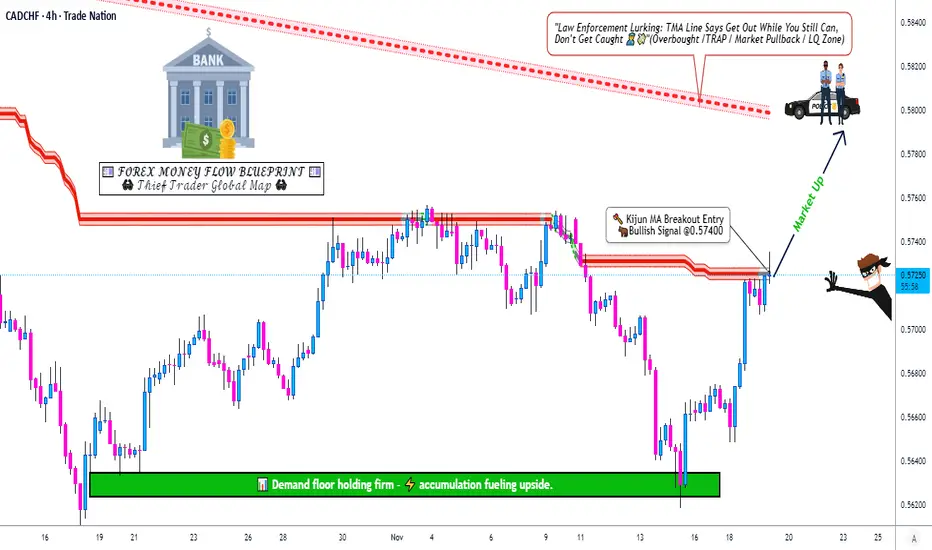
CAD/CHF ∫ Swing Trade Plan and Price RoadmapCAD/CHF Bullish Swing Setup 🚀 | Kijun Breakout & Retest in Play! 🇨🇦🇨🇭
TradingView Idea Description:
🎯 Hey Traders! Welcome to a detailed swing trade opportunity on the CAD/CHF. Let's break it down for maximum clarity and potential profits! 👍 & 💬 if you're following!
📈 Trade Thesis: Bullish Swing
The setup is simple: We are waiting for a decisive breakout and a successful retest of the Kijun-sen (Baseline from the Ichimoku Cloud) to confirm bullish momentum.
Asset: CAD/CHF (Canadian Dollar vs. Swiss Franc)
Strategy: Breakout & Retest | Swing Trade
Bias: BULLISH ✅
⚙️ Trade Plan & Execution
Trigger Zone: Watch price action around 0.57400.
Entry Signal: A clean breakout above the Kijun-sen, followed by a retest of it as new support. A bullish rejection candle (like a hammer or bullish engulfing) on the retest is your ideal confirmation.
Entry: You can enter on the retest confirmation or any point after a confirmed breakout closes above the level.
🛑 Dear Ladies & Gentleman (Thief OG's) - Risk Management is KEY! 🛑
Stop Loss (SL): My strategic stop loss is placed at 0.56800, below the recent structure.
⚠️ IMPORTANT NOTE: I am NOT recommending you use only my SL. Adjust your position size and stop loss based on your own risk tolerance and strategy. You are the captain of your own ship! 🧭
🎯 Profit Targets (PT):
TP 1: Our primary target is 0.58000.
Why Here? This level is where multiple technical factors converge:
🟥 Triangular Moving Average (TMA) acting as strong dynamic resistance.
📊 Potential overbought conditions on lower timeframes.
⚠️ A classic "trap zone" where corrections can begin.
Smart Move: This is a zone to escape with profits! Consider taking partial profits here.
⚠️ REMINDER: Just like the SL, this is MY target. You are free to take profits earlier or manage your trade based on your own analysis. Make your money, your way! 💰
🔍 Market Context & Related Pairs to Watch
Diversifying your view is crucial. Here are key pairs to keep on your radar and why:
USD/CAD ( OANDA:USDCAD ): 🔥 INVERSE Correlation. A weaker USD often means a stronger CAD (bullish for CAD/CHF). If USD/CAD is falling, it can support our bullish CAD/CHF thesis.
USD/CHF ( OANDA:USDCHF ): 🔥 POSITIVE Correlation. The CHF is a safe-haven. Often, USD/CHF and CAD/CHF can move in similar directions against the USD. A strong USD/CHF can sometimes lend strength to CAD/CHF.
EUR/CHF ( OANDA:EURCHF ): 🔥 POSITIVE Correlation. The Swiss Franc is often traded as a bloc against European currencies. Watch this for general CHF strength/weakness.
WTI Crude Oil ( BLACKBULL:WTI ): 💎 Key for CAD. The Canadian Dollar is a commodity currency, heavily linked to Oil prices. Rising Oil prices are generally BULLISH for the CAD. A strong rally in Oil could be the fundamental driver for this technical breakout.
Let's have a green and profitable trade! 🍀
#TradingView #Forex #CADCHF #SwingTrading #Ichimoku #Breakout #TechnicalAnalysis #ForexSetup #TradingIdeas #CommodityCurrencies #SafeHaven #ThiefOGs
CAD/CHF SELLERS WILL DOMINATE THE MARKET|SHORT
CAD/CHF SIGNAL
Trade Direction: short
Entry Level: 0.573
Target Level: 0.570
Stop Loss: 0.575
RISK PROFILE
Risk level: medium
Suggested risk: 1%
Timeframe: 6h
Disclosure: I am part of Trade Nation's Influencer program and receive a monthly fee for using their TradingView charts in my analysis.
✅LIKE AND COMMENT MY IDEAS✅


Update on CADCHFIn our weekly watchlist, the plan was to trade within the range — taking positions from the top of the channel down to the bottom.
If you’re already in a position, you should hold it toward the channel’s lower boundary.
If you’re still waiting for a trigger, a trendline break can provide a solid entry signal.
For now, the price is heavily interacting with the channel’s upper boundary, and as long as this level hasn’t been broken and confirmed above, we remain sellers.
Sell cadchfMedium news is coming out for the canadian dollar at 1.30gmt . Im hoping cadchf will sell and i have set my entry as i feel that its bearish
RSI is neutral at moment but could flip . Proceed with caution

CAD/CHFContinuous Bullish Bias. Buy POI's= OB + unswept liq / imb + liq to be swept.
Manage risk well.


Update on the CADCHF analysisIn a higher-cycle downtrend, as I’m writing this update, the price has managed to make a slight push above the top of the range. We now need to see whether it can break the channel top with a strong confirming candle, or if this is going to turn into a fake breakout.
We were waiting for a sell trigger on this pair since the higher-cycle trend is strongly bearish. In any case, the week is over, and we’ll review everything again next week and mark the new entry triggers.
Update CADCHFThe trigger we had on this pair has now activated. With the rejection from the channel top, the trendline break, and then the pullback, all the triggers have been confirmed, and the position is valid. If the price decides to go back up, we’ll be dealing with probabilities again — but our position is very logical and well-


CADCHF — 4H / 1H VMS BreakdownCADCHF has formed a clean triple top and printed a strong engulfing candle to the downside. Momentum is also aligned, pushing downward with clear divergence, which increases the probability of a reversal.
The challenge:
The engulfing candle formed outside of our ideal trading window, and current volume levels are not confirming yet.
1H Volume: 84 (needs to be stronger)
15M Volume: 80 (also below preferred threshold)
Momentum: Divergent and pointing down
Structure: Triple top confirmed
Trigger Candle: Already formed earlier, but volume did not follow through
Plan:
Wait for a stronger volume candle on any timeframe to validate the move.
If VMS fully aligns again, we will consider placing a limit order based on fresh structure.
Patience first. Execution second.
Not financial advice — just documenting my analysis and how I trade the VMS system.
