CELRUSDT 1D#CELR is moving inside a falling wedge pattern on the daily chart. In case of a bounce from the support and a breakout above the daily EMA100 and the wedge resistance, the potential targets are:
🎯 $0.007639
🎯 $0.009216
🎯 $0.010490
🎯 $0.011764
🎯 $0.013579
🎯 $0.015890
⚠️ Always remember to use a tig

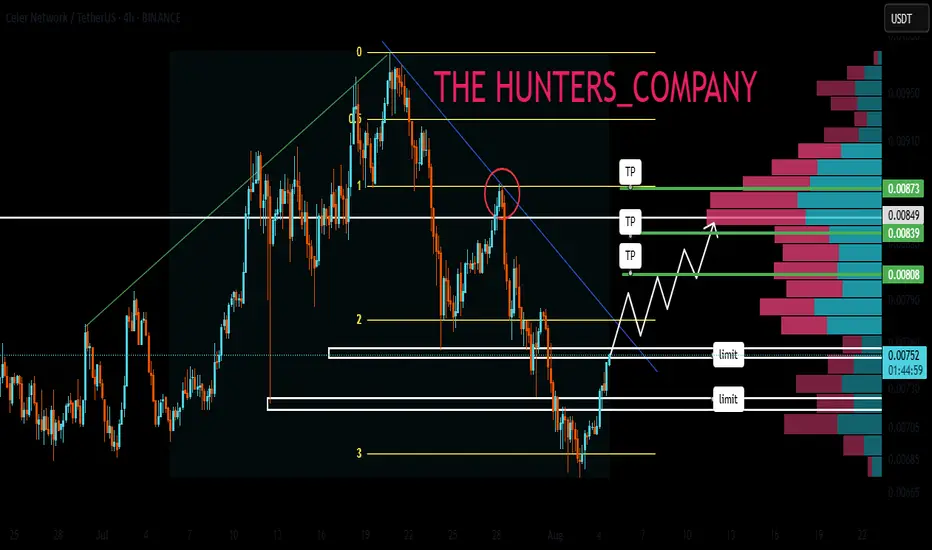
#CELRUSDT 12H ChartPrice is currently retesting the 12h breaker zone after doing a huge sweep of liquidity. MACD is showing bearish weakness, RSI is sold and EMAs are bearish. Price needs to break above this 12h breaker zone in order to expect further bullish movements.

CELRUSDT UPDATE#CELR
UPDATE
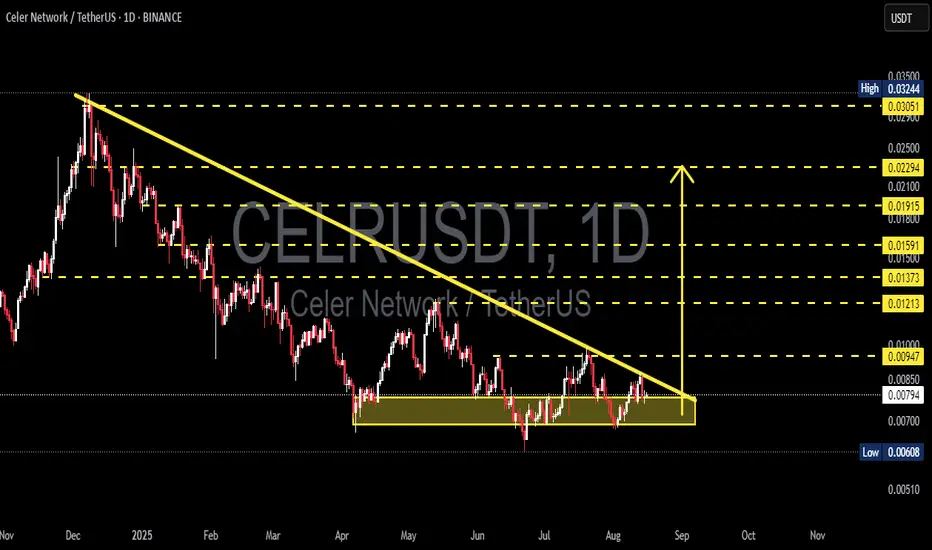
CELR Technical Setup
Pattern: Bullish falling wedge pattern
Current Price: $0.0075
Target Price: $0.0136
Target % Gain: 80.54%
$CELR is breaking out of a falling wedge pattern on the 1D timeframe. Current price is $0.0075 with a target near $0.0136, showing about 80% potential upside

CELR/USDT — Major Turning Point! Key Accumulation Zone?Celer Network (CELR) is currently standing at a critical juncture that could define its next major move.
After months trapped below a long-term descending trendline, price is once again testing a crucial area — the accumulation zone between 0.008 and 0.0072.
This yellow zone has consistently acted
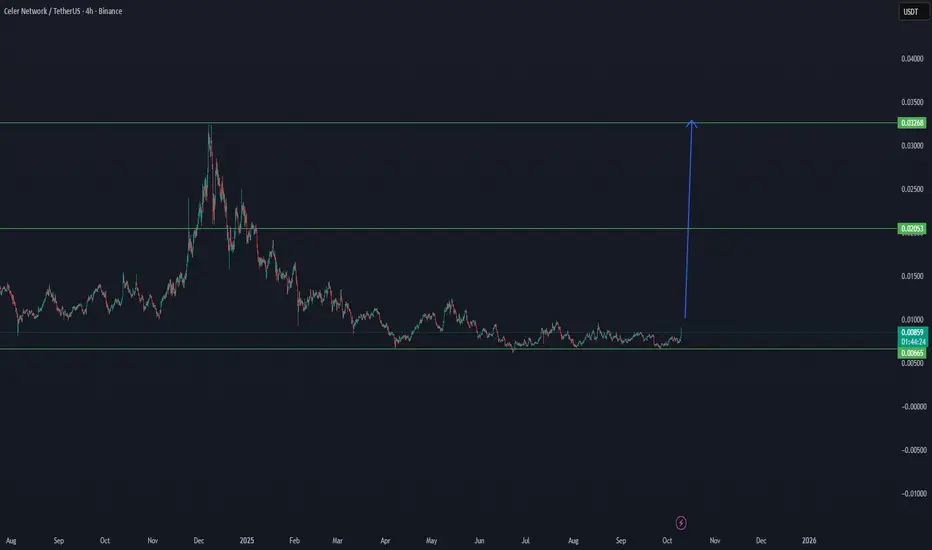
CELR NEW CYCLE ON WAYCELER NETWORK (CELR/USDT) — Cycle Bottom Formed, Reversal Phase Loading 🔄
CELR is showing clear signs of accumulation near the cycle bottom zone between $0.0066 – $0.0088, a range historically known for reversals and strong recovery moves.
📉 Accumulation Base: $0.0066 – $0.0088
🟢 Current Structur
CELR : Sensitive areaHello friends🙌
✅Considering the decline we had, you can see that the price has been well supported in the support area drawn with Fibonacci and now it seems that it wants to go up to the specified ranges, which are also good and high-volume ranges, and these areas are like magnets for the price.
✅
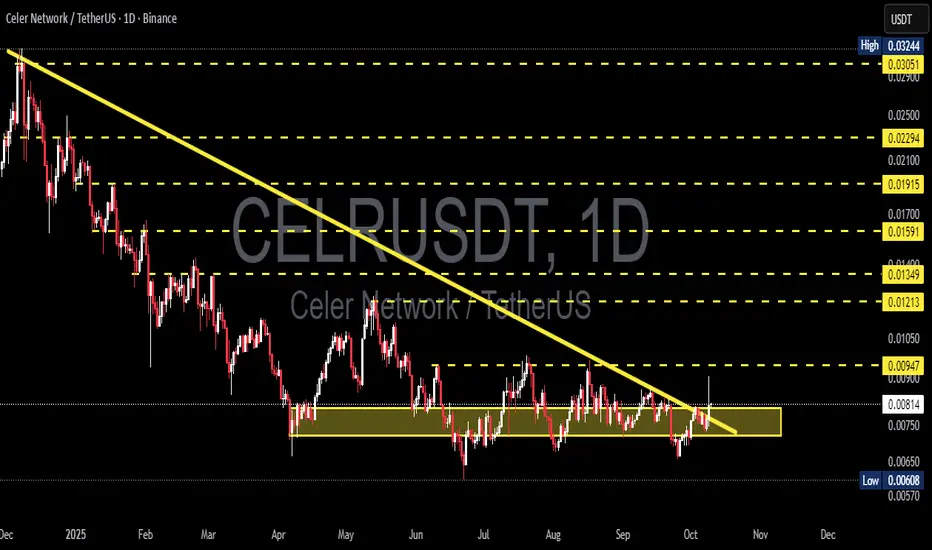
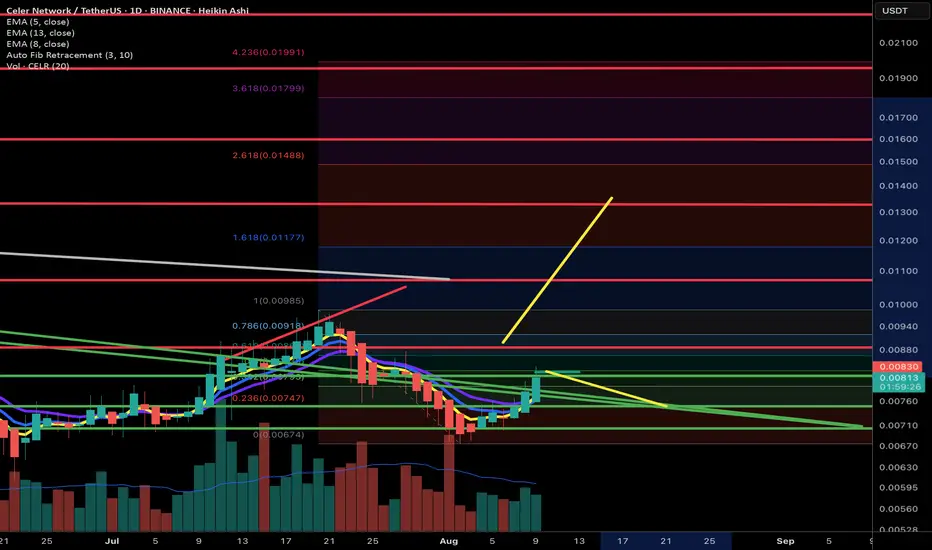
CELRUSDT – Descending Triangle: Breakout or Breakdown?Summary
Overall trend remains bearish since the late 2024/early 2025 peak (downtrend line in yellow).
Price is now compressed into a Descending Triangle:
– Falling resistance (yellow diagonal).
– Flat support / demand zone in 0.0074–0.0086.
Key horizontal levels (yellow dashed lines): 0.00947, 0.
#CELR/USDT#CELR
The price is moving within a descending channel on the 1-hour frame, adhering well to it, and is on its way to breaking it strongly upwards and retesting it.
We have a bounce from the lower boundary of the descending channel. This support is at 0.00686.
We have a downtrend on the RSI indicat

CELRUSDT 1D#CELR is on the verge of breaking above the Descending Broadening Wedge and the SMA100 on the daily chart. A confirmed breakout could set the stage for a move toward the following targets:
🎯 $0.01001
🎯 $0.01228
🎯 $0.01612
🎯 $0.01921
⚠️ As always, use a tight stop-loss and apply proper risk managem

See all ideas
Summarizing what the indicators are suggesting.
Oscillators
Neutral
SellBuy
Strong sellStrong buy
Strong sellSellNeutralBuyStrong buy
Oscillators
Neutral
SellBuy
Strong sellStrong buy
Strong sellSellNeutralBuyStrong buy
Summary
Neutral
SellBuy
Strong sellStrong buy
Strong sellSellNeutralBuyStrong buy
Summary
Neutral
SellBuy
Strong sellStrong buy
Strong sellSellNeutralBuyStrong buy
Summary
Neutral
SellBuy
Strong sellStrong buy
Strong sellSellNeutralBuyStrong buy
Moving Averages
Neutral
SellBuy
Strong sellStrong buy
Strong sellSellNeutralBuyStrong buy
Moving Averages
Neutral
SellBuy
Strong sellStrong buy
Strong sellSellNeutralBuyStrong buy
Displays a symbol's price movements over previous years to identify recurring trends.