CFXUSDT — Symmetrical Triangle: Ready for a Rally or a Breakdown📝 Full Analysis & Narrative
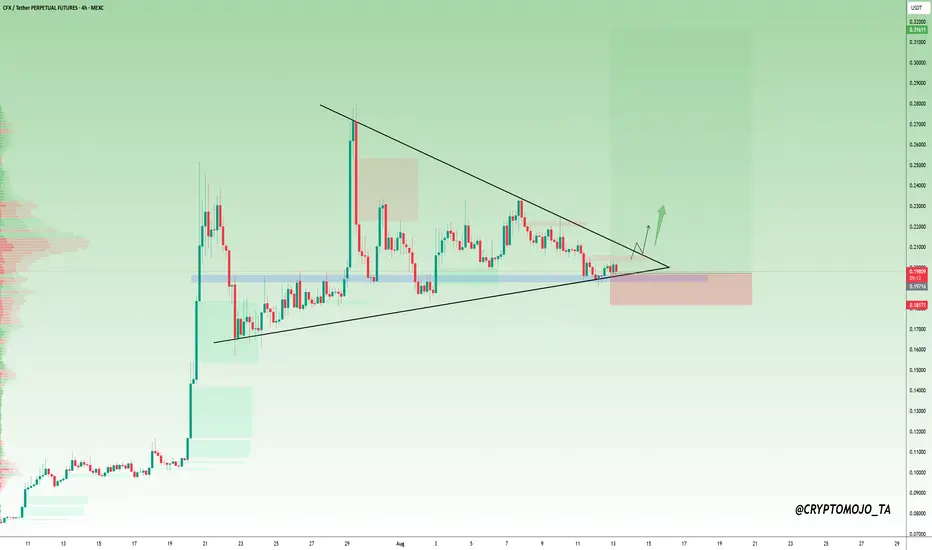
CFX/USDT is currently forming a symmetrical triangle pattern on the daily timeframe after experiencing a strong rally in July–August. This pattern is characterized by a series of lower highs (descending upper trendline) and higher lows (ascending lower trendline), gradually converging into an apex — a classic sign of consolidation with decreasing volatility.
Typically, a symmetrical triangle after a strong impulse tends to act as a continuation pattern, meaning that the price has a higher probability of resuming the prior trend (in this case, bullish). However, we must also acknowledge the possibility of a breakdown if market sentiment turns bearish.
---
🔼 Bullish Scenario
If the price manages to break above the upper trendline with a valid daily close supported by high volume, it will likely confirm a continuation of the bullish move.
Short-term targets:
$0.2000 → psychological and immediate resistance.
$0.2299 → horizontal resistance zone.
$0.2455 → key resistance before retesting previous highs.
Extended target (measured move):
Based on the triangle’s height (~$0.125), a confirmed breakout around $0.2000 projects a potential target near $0.3250, which would exceed the previous high at $0.2799.
Entry strategy:
Conservative: wait for breakout + retest of the upper trendline turned into support.
Aggressive: partial entry before the breakout near the apex (higher risk of fakeouts).
---
🔽 Bearish Scenario
If the price fails to hold and breaks below the lower trendline, bearish momentum could take control.
Short-term targets:
$0.1700 → immediate support.
$0.1550 → lower boundary of the triangle.
Extended target:
If selling pressure accelerates, price could drop toward $0.1000, or even revisit $0.0599 (the historical low shown on the chart).
Entry strategy:
Wait for a confirmed daily close below the lower trendline with strong volume.
Place stop-loss above the broken trendline or near the latest swing high.
---
🔍 Key Factors to Watch
1. Volume is critical → breakouts without volume often lead to fake moves.
2. Daily close confirmation matters more than intraday wicks.
3. Retests of broken trendlines often offer better risk/reward setups.
4. Risk management is essential: keep SL levels clear and limit position size (risk 1–2% per trade).
---
📊 Conclusion
CFX/USDT is approaching a decisive moment. The symmetrical triangle indicates that the market is in “waiting mode” before making its next major move. A breakout above could ignite a continuation rally toward $0.20 → $0.2455 and potentially $0.3250. On the other hand, a breakdown could open the door for a correction back to $0.155 or even $0.10.
Traders should wait for confirmation of direction and maintain strict risk management discipline.
---
#CFX #CFXUSDT #CryptoAnalysis #TrianglePattern #BreakoutOrBreakdown #CryptoTrading #Altcoins #ChartAnalysis #RiskManagement
CFXUSDT.P trade ideas

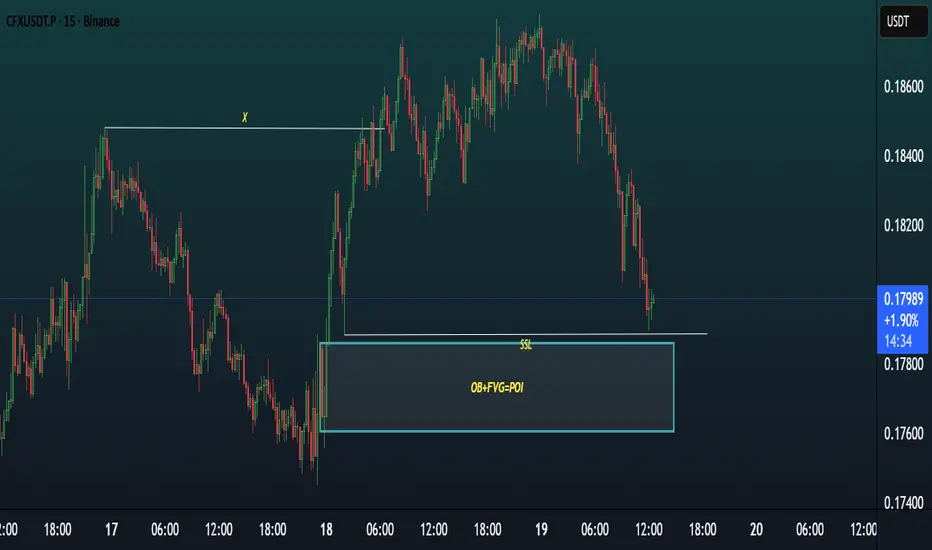
CFX/USDT Update (15m Chart)CFX/USDT Update (15m Chart)
Price is now approaching the OB + FVG confluence POI zone around 0.178 after taking out the SSL liquidity.
🔎 This is an important reaction area. If buyers step in here, we could see a potential reversal move forming.
⚡ Keep an eye on how price behaves once it taps the zone — bullish confirmation will be key before any continuation.
Conflux Smart Trade- All in Graphic
- i really doubt it will back to bottom but " who knows ?".
- Now : Nothing to buy yet.
- i do not play a breakout with CFX. Dangerous.
---------------------------------------------------------------
Trading Part
---------------------------------------------------------------
Buy : 0.1$ ish ( 10% invest )
Buy : 0.055$ ish ( 20% invest )
Buy : 0.02$ ish ( 70% invest ) ( Bottom )
---------------------------------------------------------------
TP1 : 0.6$
TP2 : 1.6$ (ATH)
---------------------------------------------------------------
- Don't be greedy with my numbers.
- Set your own SL if you are a scalper.
- Set your own Take Profit.
- Be Logic & Make Money.
Happy Tr4Ding !

#CFX/USDT — Symmetrical Triangle: Ready for a Rally or a Breakd#CFX
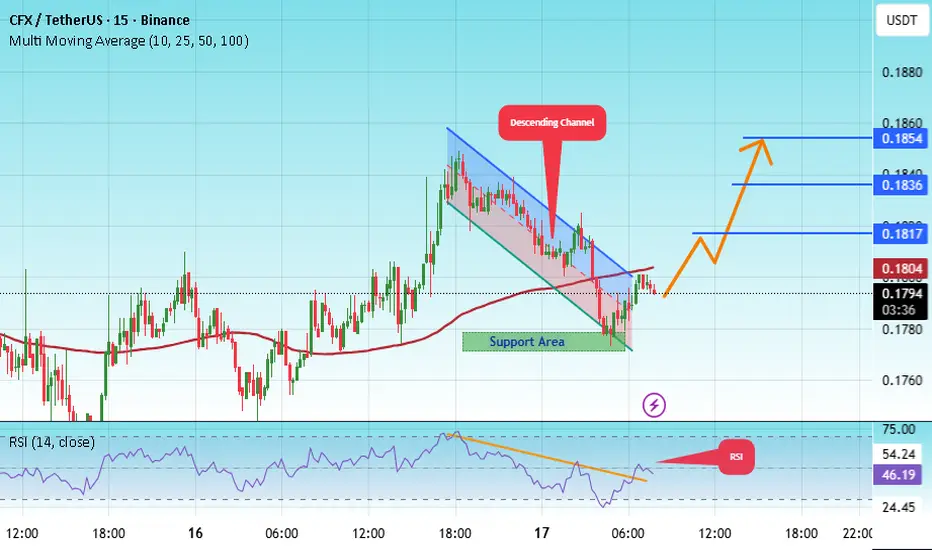
The price is moving within a descending channel on the 1-hour frame, adhering well to it, and is heading for a strong breakout and retest.
We have a bearish trend on the RSI indicator that is about to be broken and retested, which supports the upward breakout.
There is a major support area in green at 0.1777, which represents a strong support point.
We are heading for consolidation above the 100 moving average.
Entry price: 0.1795
First target: 0.1817
Second target: 0.1836
Third target: 0.1854
Don't forget a simple matter: capital management.
When you reach the first target, save some money and then change your stop-loss order to an entry order.
For inquiries, please leave a comment.
Thank you.
$CFX: my green zones are back. Time to refill our bags.LSE:CFX delivered an impressive bounce during this mini-altseason, confirming it’s a project worth keeping on the radar for the upcoming full altseason.
However, its non-US listing status could limit its performance if BlackRock launches altcoin index ETFs — as it’s unlikely Conflux would be included, meaning it wouldn’t directly benefit from institutional inflows.
That said, LSE:CFX remains a strong, China-based blockchain project, and if the Chinese government takes significant steps toward crypto adoption, this coin has the potential to skyrocket.
--------------------------------
The altcoin market just saw a solid pump, following the massive CRYPTOCAP:BTC and CRYPTOCAP:ETH institutional billion-dollar purchases.
On the Daily timeframe, we’re actually printing higher lows, showing clear market strength. The top of the range was rejected, and now it’s highly probable that the crypto market will enter a consolidation phase — a move that could push several altcoins into my buying zones.
💡 Reminder: My buying zones are areas where it’s statistically safer to buy and hold, with an almost guaranteed chance of making a solid profit on the next bounce.
What could spark the infamous Altseason?
Many altcoins share one thing in common: a major resistance line (marked in yellow). For them to pump to the moon, this line needs to be broken.
We’re also seeing a price compression — meaning the breakout could be imminent. This pullback might be your last chance to enter a long position before the real Altseason kicks off.
Possible Altseason catalysts:
📉 FED Interest Rate Cut of 1% or more.
📈 Institutional adoption through altcoin index ETFs — imagine BlackRock launching ALT10, ALT50, ALT100 ETFs, attracting massive institutional money into the altcoin market.
I believe both events could happen before the end of the year.
DYOR — but the window might be closing fast. 🚀

CFXUSDT TRADE IDEA.CFX/USDT Update (15m TF)
Market Structure: Price is currently bullish with a strong push upward after breaking structure (BOS).
Current Zone: Trading around 0.1759 after rejecting higher.
Point of Interest (POI): The highlighted demand zone near 0.1710 (OB + liquidity sweep).
Scenario:
Possible retracement into POI around 0.1710.
If demand holds, we can see continuation upward toward 0.1790–0.1800 levels.
Short-term liquidity grabs (zig-zag moves) are expected before push.
⚠️ Note: Watch for confirmation inside POI before entry. Without reaction, deeper drop is possible.

CFXUSDT 1D#CFX has formed a bullish pennant on the daily chart. A retest of the daily SMA50 is possible before the next leg up. If it breaks out above the pennant resistance, the targets are:
🎯 $0.2140
🎯 $0.2444
🎯 $0.2689
🎯 $0.2935
🎯 $0.3285
⚠️ As always, use a tight stop-loss and proper risk management.

Conflux Grows 367% · Altcoins Market Bullish ConfirmedHere is another trading pair that is doing great. This type of market action confirms our highly controversial bullish bias.
Is the altcoins market really growing in late 2025? The market has been growing for months. CFXUSDT is a perfect example. Let's review the chart.
The price patterns are the same as with other trading pairs. Let's review a few of those. As we have the same price patterns, we will be able to conclude that we will also end up with the same results.
Price patterns
A peak in December 2024, the same with the rest of the altcoins market.
This peak is followed by a strong correction that ends in April 2025, sounds familiar?
After the bottom in April there is a price bounce. In the case of CFXUSDT, the peak in May led to a double-bottom in June. This is a shy lower low and this is the end.
The initial bullish breakout, wave 1, and then the resumption of the bullish trend. As soon as the low was confirmed with the double-bottom, CFXUSDT started to grow. Between 22-June and 29-July, 37 days, Conflux Token grew 367%. That's 4.6X.
This is not the whole bull market. The entire move was very short. Just a small advance, the start, and we have massive growth.
This move ended a while ago already and see how CFXUSDT is doing, prices remain really high. The retrace is very small. This is an extreme bullish signal and reveals the altcoins market will continue to grow.
If the bullish wave were over, then we would see a strong crash after the peak-high. Instead, prices remain strong because sellers are not present, buyers continue to buy and holders continue to hold.
Never give up...
Keep going...
We are only a few days away...
The best is yet to come.
Namaste.

CFX has formed a Bearish Head & Shoulders pattern📉 LSE:CFX Market Update
LSE:CFX has formed a Bearish Head & Shoulders pattern ❌
Price has now broken down the neckline and the blue support level 🔵, confirming sellers are in control.
👉 The potential play:
Further downside is likely if bearish momentum continues.
Best to wait for a clear reversal signal or accumulation before considering longs.
⚠️ Reminder: Head & Shoulders breakdowns usually lead to accelerated bearish continuation.

CFXUSDT Forming Bullish MomentumCFXUSDT has been consolidating within a well-defined range, building strong support at lower levels while repeatedly testing resistance zones. This accumulation phase indicates that buyers are gradually stepping in, preparing for a potential breakout. The chart structure highlights that once price breaks above the upper resistance, momentum could accelerate rapidly, opening the door for a significant bullish move.
The volume profile has been supportive, showing healthy activity during this consolidation period. This suggests that market participants are closely watching the pair, and any surge in buying pressure could fuel a breakout. A successful push above resistance could mark the beginning of a strong upward trend, aligning with bullish expectations.
With a projected gain of 90% to 100%+, CFXUSDT offers an attractive opportunity for traders looking to capitalize on breakout setups. The current price action reflects a balanced structure of accumulation, which often precedes sharp rallies. If confirmed, this breakout could lead to a sustained bullish trend, making CFXUSDT one of the standout performers in the coming sessions.
✅ Show your support by hitting the like button and
✅ Leaving a comment below! (What is You opinion about this Coin)
Your feedback and engagement keep me inspired to share more insightful market analysis with you!

CFX/USDT - Bullish Breakout Imminent!🚀 Trade Setup Details:
🕯 #CFX/USDT 🔼 Buy | Long 🔼
⌛️ TimeFrame: 1D
--------------------
🛡 Risk Management (Example):
🛡 Based on $1000 Balance
🛡 Loss-Limit: 1% (Conservative)
🛡 The Signal Margin: $23.79
--------------------
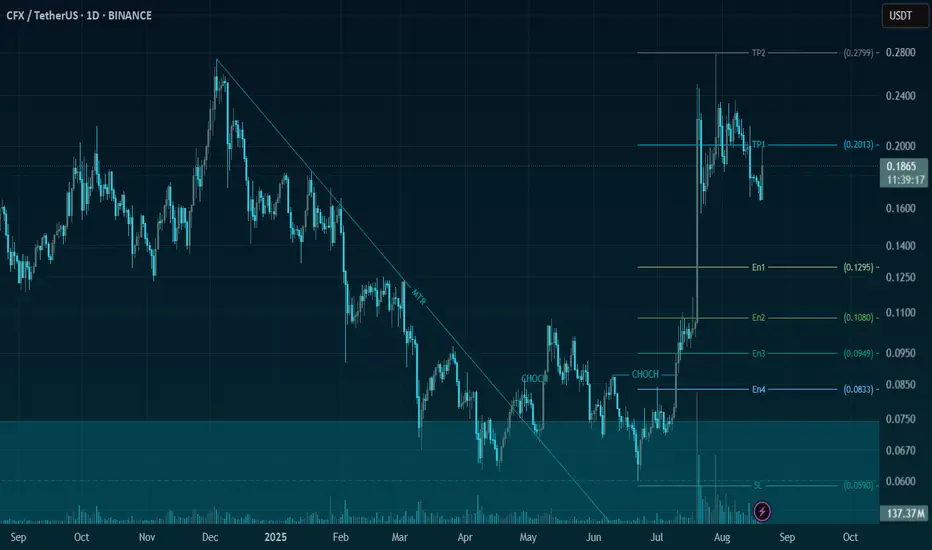
☄️ En1: 0.1295 (Amount: $2.38)
☄️ En2: 0.1079 (Amount: $8.33)
☄️ En3: 0.0948 (Amount: $10.71)
☄️ En4: 0.0833 (Amount: $2.38)
--------------------
☄️ If All Entries Are Activated, Then:
☄️ Average.En: 0.1018 ($23.79)
--------------------
☑️ TP1: 0.2012 (+97.64%) (RR:2.32)
☑️ TP2: 0.2799 (+174.95%) (RR:4.16)
☑️ TP3: 0.4257 (+318.17%) (RR:7.57)
☑️ TP4: 0.7258 (+612.97%) (RR:14.58)
☑️ TP5: 1.3079 (+1184.77%) (RR:28.18)
☑️ TP6: Open 🔝
--------------------
❌ SL: 0.059 (-42.04%) (-$10)
--------------------
💯 Maximum.Lev: 1X
⌛️ Trading Type: Position Trading
‼️ Signal Risk: 🙂 Low-Risk! 🙂
🔎 Technical Analysis Breakdown:
This technical analysis is based on Price Action, Elliott waves, SMC (Smart Money Concepts), and ICT (Inner Circle Trader) concepts. All entry points, Target Points, and Stop Losses are calculated using professional mathematical formulas. As a result, you can have an optimal trade setup based on great risk management.
📊 Sentiment & Market Context:
The momentum for CFX/USDT is strongly bullish as the market shows renewed investor confidence driven by solid fundamentals and growing adoption. Conflux (CFX) is gaining traction with its high-performance blockchain infrastructure, aiming to solve scalability and interoperability issues — key drivers fueling positive market sentiment. This makes CFX a promising candidate for a sustained upward move in the mid to long term.
⚠️ Disclaimer:
Trading involves significant risk, and past performance does not guarantee future results. This analysis is for informational purposes only and should not be considered financial advice. Always conduct your research and trade responsibly.
💡 Stay Updated:
Like this technical analysis? Follow me for more in-depth insights, technical setups, and market updates. Let's trade smarter together!
$CFX is getting ready for a move!LSE:CFX is getting ready for a move
The price has been moving inside a triangle pattern, forming lower highs and higher lows. It’s now at the edge of that triangle, which means a breakout or breakdown could happen soon.
CFX is sitting above the $0.19–$0.20 support zone. If it holds and breaks above the upper trendline, it could move up toward $0.27. But if it breaks below $0.188, that would cancel the setup.
This is a key level, the next few candles will decide the direction.
DYOR, NFA
#Altseason
CFXUSDT Long-Term Setup Buyback Zone & Big Targets AheadCFXUSDT exhibiting a potential megaphone structure with price gearing up for its final leg of the current Wave cycle. We focus on accumulating within the highlighted Buy Back Zone upon completion of wave 5 for a long-term multi-stage rally targeting:
Target 1: $1.8949
Target 2: $6.5028
Target 3 (Final): $17.7449

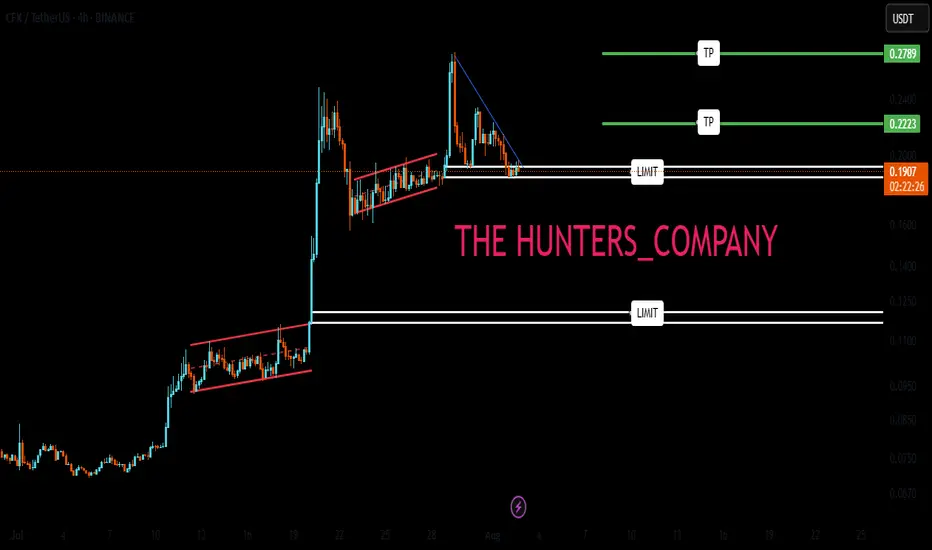
CFX/USDTKey Level Zone: 0.1970 - 0.2040
LMT v2.0 detected.
The setup looks promising—price previously trended upward with rising volume and momentum, then retested this zone cleanly. This presents an excellent reward-to-risk opportunity if momentum continues to align.
Introducing LMT (Levels & Momentum Trading)
- Over the past 3 years, I’ve refined my approach to focus more sharply on the single most important element in any trade: the KEY LEVEL.
- While HMT (High Momentum Trading) served me well—combining trend, momentum, volume, and structure across multiple timeframes—I realized that consistently identifying and respecting these critical price zones is what truly separates good trades from great ones.
- That insight led to the evolution of HMT into LMT – Levels & Momentum Trading.
Why the Change? (From HMT to LMT)
Switching from High Momentum Trading (HMT) to Levels & Momentum Trading (LMT) improves precision, risk control, and confidence by:
- Clearer Entries & Stops: Defined key levels make it easier to plan entries, stop-losses, and position sizing—no more guesswork.
- Better Signal Quality: Momentum is now always checked against a support or resistance zone—if it aligns, it's a stronger setup.
- Improved Reward-to-Risk: All trades are anchored to key levels, making it easier to calculate and manage risk effectively.
- Stronger Confidence: With clear invalidation points beyond key levels, it's easier to trust the plan and stay disciplined—even in tough markets.
Whenever I share a signal, it’s because:
- A high‐probability key level has been identified on a higher timeframe.
- Lower‐timeframe momentum, market structure and volume suggest continuation or reversal is imminent.
- The reward‐to‐risk (based on that key level) meets my criteria for a disciplined entry.
***Please note that conducting a comprehensive analysis on a single timeframe chart can be quite challenging and sometimes confusing. I appreciate your understanding of the effort involved.
Important Note: The Role of Key Levels
- Holding a key level zone: If price respects the key level zone, momentum often carries the trend in the expected direction. That’s when we look to enter, with stop-loss placed just beyond the zone with some buffer.
- Breaking a key level zone: A definitive break signals a potential stop‐out for trend traders. For reversal traders, it’s a cue to consider switching direction—price often retests broken zones as new support or resistance.
My Trading Rules (Unchanged)
Risk Management
- Maximum risk per trade: 2.5%
- Leverage: 5x
Exit Strategy / Profit Taking
- Sell at least 70% on the 3rd wave up (LTF Wave 5).
- Typically sell 50% during a high‐volume spike.
- Move stop‐loss to breakeven once the trade achieves a 1.5:1 R:R.
- Exit at breakeven if momentum fades or divergence appears.
The market is highly dynamic and constantly changing. LMT signals and target profit (TP) levels are based on the current price and movement, but market conditions can shift instantly, so it is crucial to remain adaptable and follow the market's movement.
If you find this signal/analysis meaningful, kindly like and share it.
Thank you for your support~
Sharing this with love!
From HMT to LMT: A Brief Version History
HM Signal :
Date: 17/08/2023
- Early concept identifying high momentum pullbacks within strong uptrends
- Triggered after a prior wave up with rising volume and momentum
- Focused on healthy retracements into support for optimal reward-to-risk setups
HMT v1.0:
Date: 18/10/2024
- Initial release of the High Momentum Trading framework
- Combined multi-timeframe trend, volume, and momentum analysis.
- Focused on identifying strong trending moves high momentum
HMT v2.0:
Date: 17/12/2024
- Major update to the Momentum indicator
- Reduced false signals from inaccurate momentum detection
- New screener with improved accuracy and fewer signals
HMT v3.0:
Date: 23/12/2024
- Added liquidity factor to enhance trend continuation
- Improved potential for momentum-based plays
- Increased winning probability by reducing entries during peaks
HMT v3.1:
Date: 31/12/2024
- Enhanced entry confirmation for improved reward-to-risk ratios
HMT v4.0:
Date: 05/01/2025
- Incorporated buying and selling pressure in lower timeframes to enhance the probability of trending moves while optimizing entry timing and scaling
HMT v4.1:
Date: 06/01/2025
- Enhanced take-profit (TP) target by incorporating market structure analysis
HMT v5 :
Date: 23/01/2025
- Refined wave analysis for trending conditions
- Incorporated lower timeframe (LTF) momentum to strengthen trend reliability
- Re-aligned and re-balanced entry conditions for improved accuracy
HMT v6 :
Date : 15/02/2025
- Integrated strong accumulation activity into in-depth wave analysis
HMT v7 :
Date : 20/03/2025
- Refined wave analysis along with accumulation and market sentiment
HMT v8 :
Date : 16/04/2025
- Fully restructured strategy logic
HMT v8.1 :
Date : 18/04/2025
- Refined Take Profit (TP) logic to be more conservative for improved win consistency
LMT v1.0 :
Date : 06/06/2025
- Rebranded to emphasize key levels + momentum as the core framework
LMT v2.0
Date: 11/06/2025
- Fully restructured lower timeframe (LTF) momentum logic

CFX : don't be afraidHello friends🙌
If you take risks, you will win. If you don't, you will regret it.
✅Given the good price growth, now that the price is in a correction phase, there is a good opportunity to buy with risk and capital management, of course, at the specified support levels and move with them to the set targets.
🔥Follow us for more signals🔥
*Trade safely with us*
Conflux CFX price analysis Recently, #CFX price shot up very strongly, due to the publication of the news that:
#ConfluxNetwork, China's Tier 1 blockchain, announced the launch of #Conflux 3.0 in August and announced plans to help issue a stablecoin pegged to the offshore yuan as China explores the possibility of issuing yuan stablecoins.
The news already reads as “very vague, promising...” but let's remember that we are talking about China, where crypto has been gradually banned since 2013 and finally banned in 2021.
💰 Looking at the OKX:CFXUSDT chart, we see that the price cannot be fixed above $0.19, which means that you should be careful with longs.
📈 If the words from the news are confirmed by actions, then the #CFX price will definitely consolidate above $0.19 and then it will be safe to open a long position.
🐻 And if the desired cannot be realized, then a correction to the $0.085-0.105 zone may become a new reality.
_____________________
Did you like our analysis? Leave a comment, like, and follow to get more

CFX Bulls Eyeing 38% Surge Toward Explosive 0.29 TargetHello✌
Let’s analyze Conflux’s upcoming price potential 📈.
BINANCE:CFXUSDT has shown solid bullish momentum recently, supported by a series of positive fundamental catalysts 📈. Price is now approaching a daily support zone that also aligns with a key Fibonacci retracement level. If this level holds, I’m expecting a potential move of around 38% to the upside, with a mid-term target near 0.29 . Watching closely for price action confirmation around support before considering entry 🚀.
✨We put love into every post!
Your support inspires us 💛 Drop a comment we’d love to hear from you! Thanks , Mad Whale

Sell-the-News Reversal📣 What’s up traders!
CFX just got injected with hopium from a pharma deal, a China stablecoin rumor, and the Conflux 3.0 upgrade… but here’s the thing: when price flies 119% and RSI hits 94, smart money starts reaching for the eject button. 🚨
🔥 TRADE SETUP
Bias: Short
Strategy: Sell-the-News Reversal
Entry: $0.25 – $0.27
SL: $0.29
TPs: $0.186, $0.145, $0.120
Why?
– HTF rally straight into resistance
– RSI 94 + $11M in short liquidations = exit liquidity confirmed
– OI and funding surged, now showing early cracks
– LTF BOS + failed continuation at highs.
Candle Craft | Signal. Structure. Execution.

CFX/USDT: Two-Plan Strategy for the Next MoveHello guys.
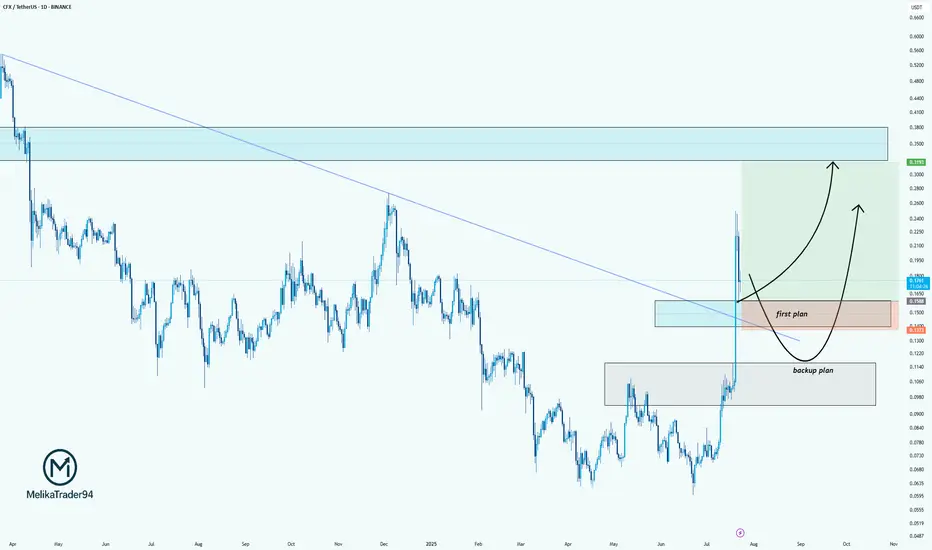
CFX just broke out of a long-term downtrend line, showing strong bullish momentum. After this sharp impulse, we're now patiently watching for the pullback zone.
Here’s my plan:
✔ First plan: Looking for a reaction around the breakout retest zone (0.1500–0.1300). This is the ideal area for a bullish continuation if buyers step in early.
✔ Backup plan: If the price drops deeper, the second demand zone (around 0.1060–0.0950) is where we’d expect stronger buyer defense.
Potential upside target: 0.31+, where price previously showed strong selling pressure.
CFX – Descending Channel Holds on Higher TimeframesLSE:CFX is displaying an interesting divergence across multiple timeframes — short-term breakout, but higher timeframes remain structurally bearish 📊
🕒 30-min Chart: Price is breaking above a descending trendline, offering a short-term bullish bias. Momentum traders might find opportunities here for quick scalps ⚡
📉 3D Chart: Price recently failed to break through the larger descending channel — leading to a minor sell-off. This shows that the broader bearish structure is still in play.
📆 Weekly Chart: LSE:CFX continues to respect a wide descending channel on the weekly timeframe. Until a clean breakout occurs, the macro trend remains bearish.
👀 What to watch:
Short-term bounce could play out, especially if the lower timeframes attract volume.
However, unless the higher timeframe structure breaks, upside will likely be limited.
A textbook case of short-term opportunity inside a long-term downtrend. Traders should adapt accordingly and monitor both momentum and structure.

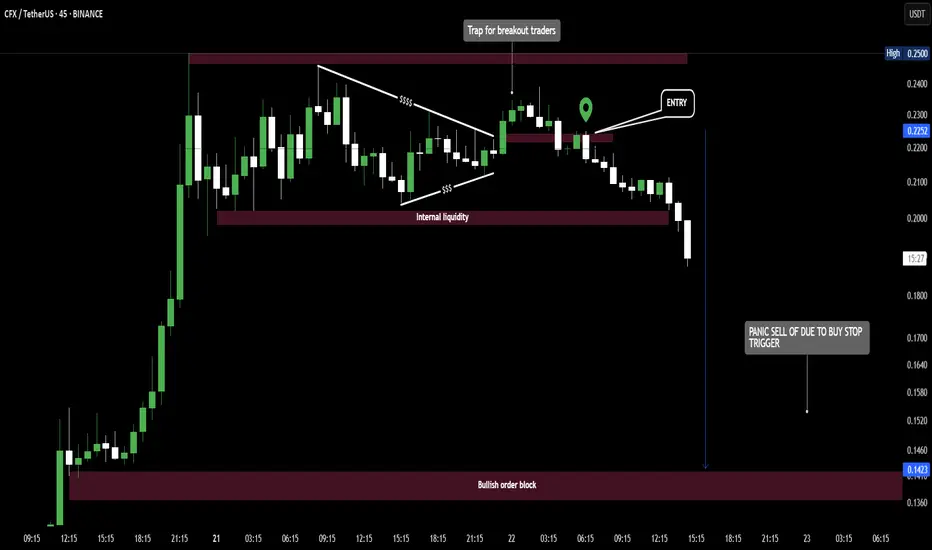
Liquidity trap Unfolded on CFX
A clean liquidity build-up inside a symmetrical triangle.
Breakout buyers were baited above resistance — triggering buy stops.
Smart money entered after the fakeout, targeting internal liquidity.
Result: sharp panic-driven sell-off into a bullish order block.
This is a classic trap > entry > liquidation setup.
Let the market come to you — not the other way around.
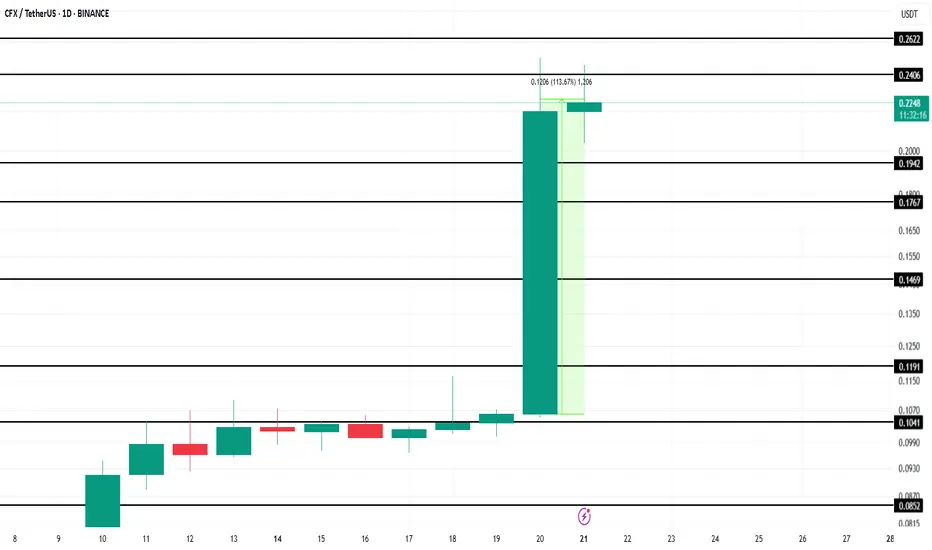
Altcoin To Watch This Week - Conflux (CFX) And Its 113% RiseBINANCE:CFXUSDT has seen a major rally, becoming one of the top-performing altcoins in recent days. Boosted by the recent Conflux Conference in Shanghai, CFX surged 113% in the last 24 hours. The altcoin is now trading at $0.22, drawing investor attention amid heightened momentum and renewed community optimism.
Excitement continues to grow as BINANCE:CFXUSDT gears up for its 3.0 upgrade , scheduled for early August. This major milestone could act as a bullish catalyst. If CFX rebounds from the $0.17 support level, the altcoin may breach $0.24 and potentially rise toward the key psychological mark of $0.30 in the short term.
However, risk remains if investors begin securing profits after the significant gains. A drop below the $0.17 support could drive BINANCE:CFXUSDT lower toward $0.11 . Such a move would reverse current bullish momentum, causing traders to reassess expectations as bearish sentiment overtakes the altcoin’s rally.
CFX BIG CANDLE Hello, good ? Me no.
We need confirmation in weekly.
But we have actually a big breakout.
A spot here is very interesting.The levels are clears, and the target is ATH.
If you go leverage, x2 is good and safe.
Good luck all, God Bless you.
